HOT TOPICS LIST
- MACD
- Fibonacci
- RSI
- Gann
- ADXR
- Stochastics
- Volume
- Triangles
- Futures
- Cycles
- Volatility
- ZIGZAG
- MESA
- Retracement
- Aroon
INDICATORS LIST
LIST OF TOPICS
PRINT THIS ARTICLE
by Matt Blackman
During its heyday in March 2000, this stock hit a high of $69.50. By September 2001, it had plummeted to a meager $0.31. Slowly but surely, it has been making a comeback in both price and respectability.
Position: Accumulate
Matt Blackman
Matt Blackman is a full-time technical and financial writer and trader. He produces corporate and financial newsletters, and assists clients in getting published in the mainstream media. He is the host of TradeSystemGuru.com. Matt has earned the Chartered Market Technician (CMT) designation. Find out what stocks and futures Matt is watching on Twitter at www.twitter.com/RatioTrade
PRINT THIS ARTICLE
BOLLINGER BANDS
The LookSmart Squeeze
01/13/04 01:17:30 PMby Matt Blackman
During its heyday in March 2000, this stock hit a high of $69.50. By September 2001, it had plummeted to a meager $0.31. Slowly but surely, it has been making a comeback in both price and respectability.
Position: Accumulate
| As Internet search engines mark their tenth birthday, it is interesting to consider how much things have changed. Back in the good old Internet days just four years ago, search engines were flying high. But a number of them are gone and as the rest fight for market share, LookSmart Ltd. (LOOK - Nasdaq) has been slowly but surely gaining respect and profitability. |
| Since September 2002, quarterly revenues have doubled from $20 to $40 million and earnings, which have stayed in the black, are rising. The modest price/earnings ratio of 4.7 and equally attractive price/book and price/sales of 2.29 and 1.26 respectively, are causing investors and traders to sit up and pay attention again. |

|
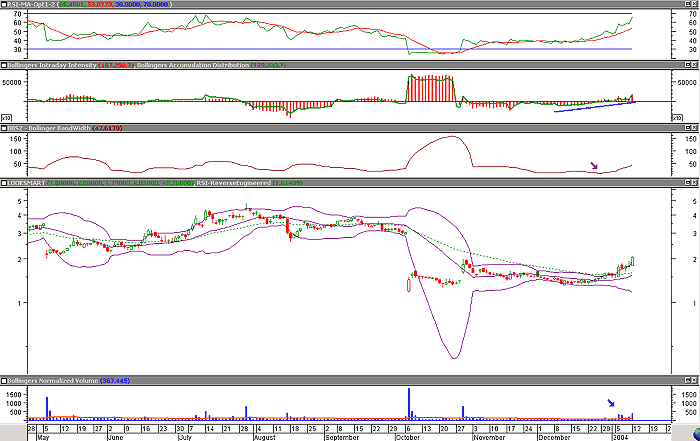
| Figure 1 – Daily chart of LookSmart Ltd. (LOOK) showing Bollinger Bands, Bandwidth, (third window), Intraday Intensity and Accumulation Distribution Indexes (second window) and Relative Strength Index (RSI) in top window. The lower window shows normalized volume to quickly identify points where volume exceeds the 50-day moving average (orange line). |
| Graphic provided by: MetaStock. |
| |
| John Bollinger describes one way to properly employ his namesake bands in his 2002 publication, Bollinger on Bollinger Bands by combining a price-based indicator like the RSI, with one or two indicators that include volume such as the Intraday Intensity or Accumulation Distribution Index. One example is what he calls a buying Squeeze where volatility falls to historically low levels, in this case when the bands are at a six-month minimum distance (dark magenta arrow in window two) with positive divergence between the Intraday Intensity and/or Accumulation Distribution Indexes and price. Volume should also be above its 50-day moving average on the breakout. Other confirmation signals could include a trendline or significant resistance level break. LOOK hit a six-month minimum volatility level on December 26 where it stayed until December 29, 2003 confirming that a Squeeze had occurred accompanied by positive divergence with three indicators. It is also interesting to note that an island reversal looks to be taking place with a minimum target (pre-gap) price of $2.93. From both a fundamental and technical point, LOOK is worth attention if you are in the market for a volatile inexpensive stock that has limited downside but significant upside potential. |
Matt Blackman is a full-time technical and financial writer and trader. He produces corporate and financial newsletters, and assists clients in getting published in the mainstream media. He is the host of TradeSystemGuru.com. Matt has earned the Chartered Market Technician (CMT) designation. Find out what stocks and futures Matt is watching on Twitter at www.twitter.com/RatioTrade
| Company: | TradeSystemGuru.com |
| Address: | Box 2589 |
| Garibaldi Highlands, BC Canada | |
| Phone # for sales: | 604-898-9069 |
| Fax: | 604-898-9069 |
| Website: | www.tradesystemguru.com |
| E-mail address: | indextradermb@gmail.com |
Traders' Resource Links | |
| TradeSystemGuru.com has not added any product or service information to TRADERS' RESOURCE. | |
Click here for more information about our publications!
PRINT THIS ARTICLE

|

Request Information From Our Sponsors
- StockCharts.com, Inc.
- Candle Patterns
- Candlestick Charting Explained
- Intermarket Technical Analysis
- John Murphy on Chart Analysis
- John Murphy's Chart Pattern Recognition
- John Murphy's Market Message
- MurphyExplainsMarketAnalysis-Intermarket Analysis
- MurphyExplainsMarketAnalysis-Visual Analysis
- StockCharts.com
- Technical Analysis of the Financial Markets
- The Visual Investor
- VectorVest, Inc.
- Executive Premier Workshop
- One-Day Options Course
- OptionsPro
- Retirement Income Workshop
- Sure-Fire Trading Systems (VectorVest, Inc.)
- Trading as a Business Workshop
- VectorVest 7 EOD
- VectorVest 7 RealTime/IntraDay
- VectorVest AutoTester
- VectorVest Educational Services
- VectorVest OnLine
- VectorVest Options Analyzer
- VectorVest ProGraphics v6.0
- VectorVest ProTrader 7
- VectorVest RealTime Derby Tool
- VectorVest Simulator
- VectorVest Variator
- VectorVest Watchdog
