HOT TOPICS LIST
- MACD
- Fibonacci
- RSI
- Gann
- ADXR
- Stochastics
- Volume
- Triangles
- Futures
- Cycles
- Volatility
- ZIGZAG
- MESA
- Retracement
- Aroon
INDICATORS LIST
LIST OF TOPICS
PRINT THIS ARTICLE
by Koos van der Merwe
Although Paul Allen is majority stock holder in this company, it still has experienced significant losses in its stock value. Is it now on the rebound? A breakout from a triangle formation gives shareholders some hope.
Position: Accumulate
Koos van der Merwe
Has been a technical analyst since 1969, and has worked as a futures and options trader with First Financial Futures in Johannesburg, South Africa.
PRINT THIS ARTICLE
TRIANGLES
Charter Communications Inc. And The Golden Touch Of Paul Allen
01/16/04 10:11:26 AMby Koos van der Merwe
Although Paul Allen is majority stock holder in this company, it still has experienced significant losses in its stock value. Is it now on the rebound? A breakout from a triangle formation gives shareholders some hope.
Position: Accumulate
| Through its various subsidiaries Charter Communications operates cable systems in the United States. The company has revenue of $4.78B yet is not showing a profit. Its revenue growth was 15.50% with a gross profit of $2.76B. It has $31.04m of shares sold short as of December 8, 2003. And yet a chart of Charter Communications has traced a consolidation triangle and has broken out upwards. Is this triangle the result of a "hope" that the company may have won the court battle and the share price would have then shot up as the massive short position would have been covered, or is it something that is yet to be announced? The opinions of various analysts tell very little with the mean recommendation actually falling this week. |
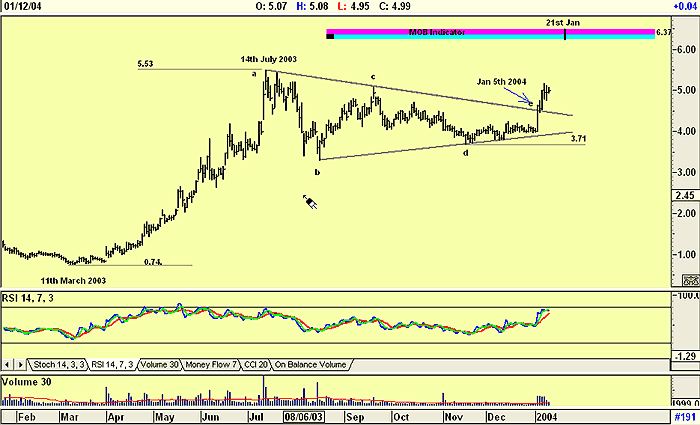
| Let's see what the chart says. On March 11, 2003, Charter hit a low of $0.74. From that date it has been climbing steadily to top out at $5.53 on July 14th of the same year. The share price then started moving sideways to form a consolidation triangle, as shown on the chart, over a period of almost six months. On January 5, 2004 it broke upwards out of the triangle on strong volume. This is a very positive sign and suggests a target for the share of $13.29 ($5.53 - 0.74 = $4.79 + $3.71 = $13.29). The Make Or Break (MOB) indicator, a propriety of Advanced Get, suggests a far more conservative target of $6.37. The MOB study is an excellent tool that can help find the target price area for the end of an Elliott wave 5, or for any pattern that has an impulse-correction-impulse pattern. Although the chart does not easily show a wave pattern, the present movement could be a major Wave I and Wave II, an impulse pattern for the MOB study. |

|
| Graphic provided by: AdvancedGET. |
| |
| There are 121 days between "a" and "e." With the average week equal to five trading days, this translates into 24.2 weeks. I mention this because an obscure rule produced by an obscure man named Henry Paget, worked out that the number of weeks of sideways movement gives you the number of days for a breakout. Using Paget's rule, there should be a 24-day upward move before a correction. The MOB target date is January 21, less than Paget's calculation, so at the very least we can target January 21 as the date for a correction. |
| A look at the RSI indicator also suggests further upside is possible, as does the fact that volume fell as the price fell over the past two days. Falling volume on a falling price is a sign of strength. Finally, the trading range for January 12th is an inside day trading pattern. This occurs when today's high is less than yesterdays high, and today's low is greater than yesterday's low. Inside trading patterns in themselves are not a significant indicator, but past experience has taught me that they can lead to significant movement in the market in the following three to five days. |
| Possibly the price could fall to the upper triangular line, "a,c,e" and use it as a support level before rising to one of the suggested targets. But whatever the movement of the share price in the days ahead, it looks interesting and Paul Allen's golden touch could be a benefit. |
Has been a technical analyst since 1969, and has worked as a futures and options trader with First Financial Futures in Johannesburg, South Africa.
| Address: | 3256 West 24th Ave |
| Vancouver, BC | |
| Phone # for sales: | 6042634214 |
| E-mail address: | petroosp@gmail.com |
Click here for more information about our publications!
Comments
Date: 01/16/04Rank: 5Comment:

Request Information From Our Sponsors
- StockCharts.com, Inc.
- Candle Patterns
- Candlestick Charting Explained
- Intermarket Technical Analysis
- John Murphy on Chart Analysis
- John Murphy's Chart Pattern Recognition
- John Murphy's Market Message
- MurphyExplainsMarketAnalysis-Intermarket Analysis
- MurphyExplainsMarketAnalysis-Visual Analysis
- StockCharts.com
- Technical Analysis of the Financial Markets
- The Visual Investor
- VectorVest, Inc.
- Executive Premier Workshop
- One-Day Options Course
- OptionsPro
- Retirement Income Workshop
- Sure-Fire Trading Systems (VectorVest, Inc.)
- Trading as a Business Workshop
- VectorVest 7 EOD
- VectorVest 7 RealTime/IntraDay
- VectorVest AutoTester
- VectorVest Educational Services
- VectorVest OnLine
- VectorVest Options Analyzer
- VectorVest ProGraphics v6.0
- VectorVest ProTrader 7
- VectorVest RealTime Derby Tool
- VectorVest Simulator
- VectorVest Variator
- VectorVest Watchdog
