HOT TOPICS LIST
- MACD
- Fibonacci
- RSI
- Gann
- ADXR
- Stochastics
- Volume
- Triangles
- Futures
- Cycles
- Volatility
- ZIGZAG
- MESA
- Retracement
- Aroon
INDICATORS LIST
LIST OF TOPICS
PRINT THIS ARTICLE
by Ashwani Gujral
Entering a trend on a retracement is a low risk strategy. But how do you know when a retracement will end? There is no one method that gives the exact answer but a variety of methods give a fair idea of where it could end.
Position: Buy
Ashwani Gujral
He is founder of AGIP Securities Pvt. Ltd. which offers money management services, live chat rooms (during market hours) and independent technical analysis consultancy. The company has a big media presence from the likes of CNBC, NDTV Profit, and ZEE Business.
PRINT THIS ARTICLE
RETRACEMENT
Entering The S&P 500 On Retracements
01/15/04 10:39:23 AMby Ashwani Gujral
Entering a trend on a retracement is a low risk strategy. But how do you know when a retracement will end? There is no one method that gives the exact answer but a variety of methods give a fair idea of where it could end.
Position: Buy
| Warren Buffet once said, "I would rather be vaguely right than precisely wrong." Nowhere is this more true than in technical analysis. Often people new to the field try to find exact levels rather than defining overbought and oversold areas. Novice traders can often get into the trap of overanalyzing their charts and placing too much emphasis solely on stock patterns. I have always used confluence of indicators to make my trading decisions. |
| In this article, I will show a number of methods to identify low risk entry points on the S&P 500. No one method is infallable, and using more than one can lead me to a vaguely right answer. In this case, I don't want to be exactly right. |

|
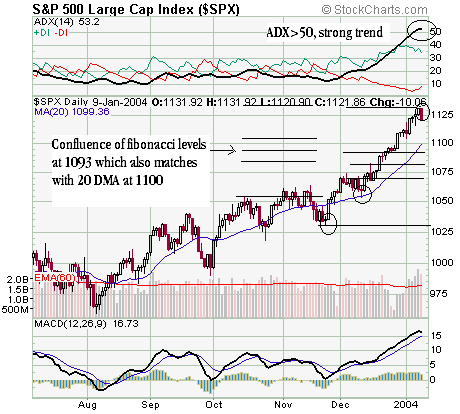
| Figure 1: Daily chart of the S&P 500. |
| Graphic provided by: Stockcharts.com. |
| |
| The daily chart of the S&P 500 shows what may be the beginning of a retracement. As traders we would like to take a low risk entry into an equity that appears to be in a strong trend. An ADX of above 50 confirms a strong trend. So, to get an approximate idea, I've put a 20-day simple moving average (SMA) onto the chart. In the past the market has corrected to below the 20-day SMA and then rallied to higher highs. Now the entry technique here is to go long as soon as the price breaks above the 20-day SMA. The moving average also indicates that the S&P could correct to around 1100. I've added the Fibonacci levels from two different pivots (both circled) to the top of the move. As you can see, there is confluence of levels at 1093. Now I have a fair idea that the S&P 500 will retrace to the 1093-1100 area. But it is not enough that the market reach this level. It also needs to bounce back and show strength. Therefore buying should be done only after the price retraces and goes back to the 20-day SMA. |
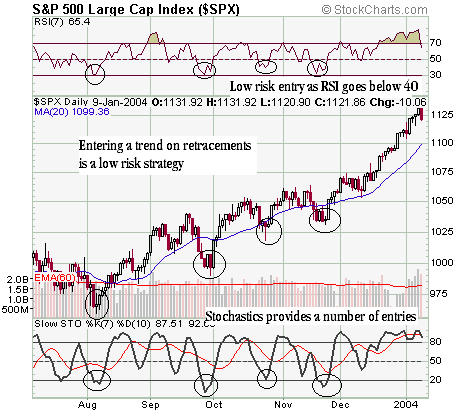
 Figure 2: Low risk entry points to the S&P 500. In the second chart I've shown two more methods for entering trends. These happen to coincide with signals from the first chart. The 14-period RSI in bull markets often retraces to around 40 and then bounces back to continue its rally. Similarly the slow stochastic with the 7,10 settings offered four entries in four months. Each time the %K drops to about 20, forms a loop and goes above %D, a buy signal is given. These are your low risk entry points. |
| By using all these methods: 1. We have a fair idea where a reasonable retracement should end. 2. We know where to look for oversold conditions. 3. We have triggers so that buying is done only when fresh strength is visible. I certainly do not mean that each and every indicator should do exactly what I have described, but overall, a majority of them should agree and be suppored by price action. By taking such low risk entries, you get a stop very close to your entries and reduce your risk in trading. As you must have noticed, I have not tried to look for exact answers because there are none. You need to use a lot of finesse -- Technical analysis is both an art and a science. |
He is founder of AGIP Securities Pvt. Ltd. which offers money management services, live chat rooms (during market hours) and independent technical analysis consultancy. The company has a big media presence from the likes of CNBC, NDTV Profit, and ZEE Business.
| Title: | Chief mkt strategist |
| Company: | AGIP Securities |
| India | |
| Phone # for sales: | 9871066337 |
| Website: | www.ashwanigujral.com |
| E-mail address: | contact@ashwanigujral.com |
Traders' Resource Links | |
| AGIP Securities has not added any product or service information to TRADERS' RESOURCE. | |
Click here for more information about our publications!
PRINT THIS ARTICLE

Request Information From Our Sponsors
- StockCharts.com, Inc.
- Candle Patterns
- Candlestick Charting Explained
- Intermarket Technical Analysis
- John Murphy on Chart Analysis
- John Murphy's Chart Pattern Recognition
- John Murphy's Market Message
- MurphyExplainsMarketAnalysis-Intermarket Analysis
- MurphyExplainsMarketAnalysis-Visual Analysis
- StockCharts.com
- Technical Analysis of the Financial Markets
- The Visual Investor
- VectorVest, Inc.
- Executive Premier Workshop
- One-Day Options Course
- OptionsPro
- Retirement Income Workshop
- Sure-Fire Trading Systems (VectorVest, Inc.)
- Trading as a Business Workshop
- VectorVest 7 EOD
- VectorVest 7 RealTime/IntraDay
- VectorVest AutoTester
- VectorVest Educational Services
- VectorVest OnLine
- VectorVest Options Analyzer
- VectorVest ProGraphics v6.0
- VectorVest ProTrader 7
- VectorVest RealTime Derby Tool
- VectorVest Simulator
- VectorVest Variator
- VectorVest Watchdog
