HOT TOPICS LIST
- MACD
- Fibonacci
- RSI
- Gann
- ADXR
- Stochastics
- Volume
- Triangles
- Futures
- Cycles
- Volatility
- ZIGZAG
- MESA
- Retracement
- Aroon
INDICATORS LIST
LIST OF TOPICS
PRINT THIS ARTICLE
by Ashwani Gujral
The telecom sector has been moving up recently, thanks to companies like Nokia. Ahead of the pack, Nokia broke out of a 2-year consolidationon on an upward gap. Here's how you can trade that gap.
Position: Buy
Ashwani Gujral
He is founder of AGIP Securities Pvt. Ltd. which offers money management services, live chat rooms (during market hours) and independent technical analysis consultancy. The company has a big media presence from the likes of CNBC, NDTV Profit, and ZEE Business.
PRINT THIS ARTICLE
GAPS
Nokia Gaps Out Of A Basing Formation
01/15/04 10:44:42 AMby Ashwani Gujral
The telecom sector has been moving up recently, thanks to companies like Nokia. Ahead of the pack, Nokia broke out of a 2-year consolidationon on an upward gap. Here's how you can trade that gap.
Position: Buy
| Gaps are breaks or "holes" in a chart created by an opening price move. If today's low is above yesterday's high or today's high is below yesterday's low, then the market has opened with a gap. As with other technical analysis moves, gaps are understood much better after the fact. It is only in later sessions that you can tell what kind of gap it was. There are two ways I like to trade a gap. First, I believe all gaps are eventually filled, so I look closely at the action following the creation of a gap. I like to buy when the prices are falling back to a support line, filling the gap. This is true for area gaps. I also trade gaps by buying when the stock consolidates and then moves on. If the stock never stops and consolidates but keeps moving up like a runaway train, then I get out of the way and wait for the next train. I may miss some moves to the upside, but in my experience, on a percentage basis, it's not worth chasing gaps. |
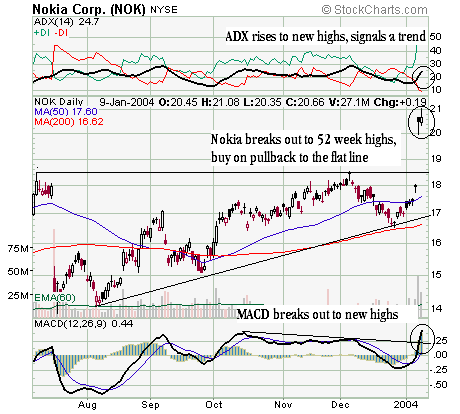
| It is often unclear what type of gap you are dealing with until your stop-loss has been triggered. So you need to be cautious and look for further confirmation. I use a confluence of indicators, patterns and time frames for further verification. Looking at Nokia, the daily chart shows the stock has made a 52-week high. A 52-week high obviously means new buyers think the price should break out of the current trading range. Also the daily chart shows an ascending triangle with the prices breaking out on a gap. To review, in an ascending triangle it is quite common for the prices to pull back towards the horizontal line, take support, and then rise. Taking these two factors into account, I have decided not to buy into the stock until the price fills the gap, returns to horizontal line, and the ADX rises above 20, signaling a trend in Nokia stock. |

|
| Figure 1: Daily chaart of Nokia. |
| Graphic provided by: Stockcharts.com. |
| |
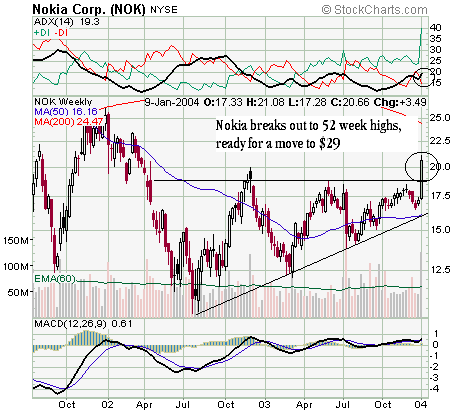
| Now look at the weekly chart. The price has just broken out of a huge ascending triangle. Again it is likely that prices will retrace to the horizontal line, thereby giving me a low risk entry. The target for this ascending triangle is $29. Other than the gap, this stock appears to have bottomed out and should see much better days. But what if the price doesn't retrace? Then it should consolidate. And if it doesn't consolidate and keeps running up, I would move on to another stock. |
 Figure 2: Weekly chart of Nokia. To summarize, you should buy into gaps only after they have been filled. Most are filled because a gap is a panic or euphoric reaction and when the emotion dies down, the gap is filled. And all traders know they shouldn't chase either euphoria or panic. I would buy or sell into a gap when it's retracing in the opposite direction of the market, and when the stock, as in the case of Nokia, is in a strong trend. This type of gap provides a very low risk and a highly profitable trade. |
He is founder of AGIP Securities Pvt. Ltd. which offers money management services, live chat rooms (during market hours) and independent technical analysis consultancy. The company has a big media presence from the likes of CNBC, NDTV Profit, and ZEE Business.
| Title: | Chief mkt strategist |
| Company: | AGIP Securities |
| India | |
| Phone # for sales: | 9871066337 |
| Website: | www.ashwanigujral.com |
| E-mail address: | contact@ashwanigujral.com |
Traders' Resource Links | |
| AGIP Securities has not added any product or service information to TRADERS' RESOURCE. | |
Click here for more information about our publications!
Comments
Date: 05/24/04Rank: 5Comment:

|

Request Information From Our Sponsors
- StockCharts.com, Inc.
- Candle Patterns
- Candlestick Charting Explained
- Intermarket Technical Analysis
- John Murphy on Chart Analysis
- John Murphy's Chart Pattern Recognition
- John Murphy's Market Message
- MurphyExplainsMarketAnalysis-Intermarket Analysis
- MurphyExplainsMarketAnalysis-Visual Analysis
- StockCharts.com
- Technical Analysis of the Financial Markets
- The Visual Investor
- VectorVest, Inc.
- Executive Premier Workshop
- One-Day Options Course
- OptionsPro
- Retirement Income Workshop
- Sure-Fire Trading Systems (VectorVest, Inc.)
- Trading as a Business Workshop
- VectorVest 7 EOD
- VectorVest 7 RealTime/IntraDay
- VectorVest AutoTester
- VectorVest Educational Services
- VectorVest OnLine
- VectorVest Options Analyzer
- VectorVest ProGraphics v6.0
- VectorVest ProTrader 7
- VectorVest RealTime Derby Tool
- VectorVest Simulator
- VectorVest Variator
- VectorVest Watchdog
