HOT TOPICS LIST
- MACD
- Fibonacci
- RSI
- Gann
- ADXR
- Stochastics
- Volume
- Triangles
- Futures
- Cycles
- Volatility
- ZIGZAG
- MESA
- Retracement
- Aroon
INDICATORS LIST
LIST OF TOPICS
PRINT THIS ARTICLE
by Ashwani Gujral
A head and shoulders pattern can be both of the consolidation and the reversal variety. American Medical Systems Holdings Inc. has one of each in its daily and weekly chart, with both suggesting the same outcome. Volume is a critical factor in determining the power of the breakout/breakdown and the achievement of targets.
Position: Buy
Ashwani Gujral
He is founder of AGIP Securities Pvt. Ltd. which offers money management services, live chat rooms (during market hours) and independent technical analysis consultancy. The company has a big media presence from the likes of CNBC, NDTV Profit, and ZEE Business.
PRINT THIS ARTICLE
HEAD & SHOULDERS
A Head And Shoulders Consolidation And Reversal
01/15/04 08:06:50 AMby Ashwani Gujral
A head and shoulders pattern can be both of the consolidation and the reversal variety. American Medical Systems Holdings Inc. has one of each in its daily and weekly chart, with both suggesting the same outcome. Volume is a critical factor in determining the power of the breakout/breakdown and the achievement of targets.
Position: Buy
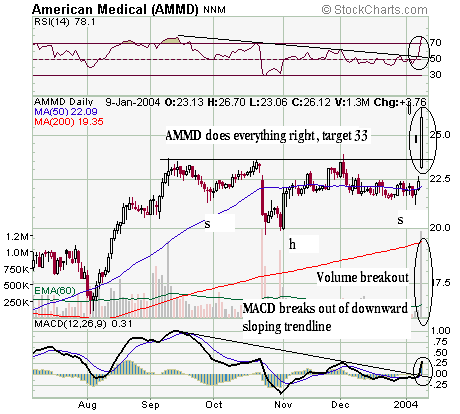
| Trading using technical analysis is mostly about trading with the trend. No trading pattern gives as clear an indication of trend reversals as the head and shoulders. I will discuss an inverse head and shoulders pattern as shown in the chart below. In theory when a stock makes a low, then make an even lower low, and then fails to make a third lower low, this is signaling a change of trend, providing that the stock shows strength in the opposite direction. For a "normal," rather than inverse, head and shoulders pattern there would be a series of highs (following the same pattern of lows as the reversal pattern) and the stock would show weakness in the opposite direction. |

|
| Figure 1: Daily chart of American Medical Systems Holdings Inc. |
| Graphic provided by: Stockcharts.com. |
| |
| In this article, the daily chart shows a head and shoulder consolidation breaking out on the upside with volume. The target for this head and shoulders consolidation is determined by measuring the move preceding the consolidation pattern and adding it onto the top. The breakout on heavy volume leads to confidence that this breakout is genuine. Further signs that the consolidation is ending are the breakout of RSI and MACD from their downward sloping trendlines. More conformation is available, as always, from the weekly chart. |
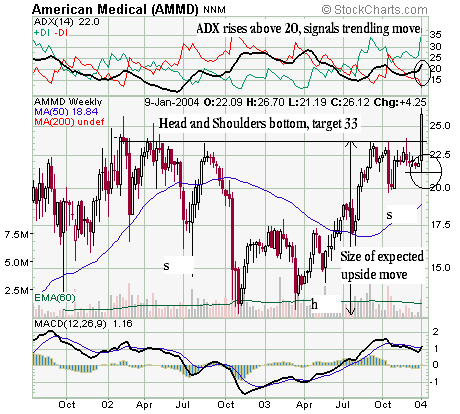
 Figure 2: Weekly chart of American Medical Systems Holdings Inc. In the weekly chart, a head and shoulders bottom has formed over a period of two and a half years. This is a good base for a stock to give a decent move to the upside. The ADX is now moving above 20, which is a sign of a strengthening trend. Measuring the distance between the neckline and the head, and adding it on top of the neckline as shown on the chart, determines the target of the breakout. A stop-loss can be placed below $21.25, a previous pivot (circled area in the weekly chart) for all long trades. |
| Finally, an important concept is participation or volume. In the real world technical analysis, you may find a lot of patterns that resemble classical patterns but fail because their breakouts/breakdowns do not occur convincingly. I would ignore patterns which breakout/breakdown without good volume. |
He is founder of AGIP Securities Pvt. Ltd. which offers money management services, live chat rooms (during market hours) and independent technical analysis consultancy. The company has a big media presence from the likes of CNBC, NDTV Profit, and ZEE Business.
| Title: | Chief mkt strategist |
| Company: | AGIP Securities |
| India | |
| Phone # for sales: | 9871066337 |
| Website: | www.ashwanigujral.com |
| E-mail address: | contact@ashwanigujral.com |
Traders' Resource Links | |
| AGIP Securities has not added any product or service information to TRADERS' RESOURCE. | |
Click here for more information about our publications!
Comments

Request Information From Our Sponsors
- StockCharts.com, Inc.
- Candle Patterns
- Candlestick Charting Explained
- Intermarket Technical Analysis
- John Murphy on Chart Analysis
- John Murphy's Chart Pattern Recognition
- John Murphy's Market Message
- MurphyExplainsMarketAnalysis-Intermarket Analysis
- MurphyExplainsMarketAnalysis-Visual Analysis
- StockCharts.com
- Technical Analysis of the Financial Markets
- The Visual Investor
- VectorVest, Inc.
- Executive Premier Workshop
- One-Day Options Course
- OptionsPro
- Retirement Income Workshop
- Sure-Fire Trading Systems (VectorVest, Inc.)
- Trading as a Business Workshop
- VectorVest 7 EOD
- VectorVest 7 RealTime/IntraDay
- VectorVest AutoTester
- VectorVest Educational Services
- VectorVest OnLine
- VectorVest Options Analyzer
- VectorVest ProGraphics v6.0
- VectorVest ProTrader 7
- VectorVest RealTime Derby Tool
- VectorVest Simulator
- VectorVest Variator
- VectorVest Watchdog
