HOT TOPICS LIST
- MACD
- Fibonacci
- RSI
- Gann
- ADXR
- Stochastics
- Volume
- Triangles
- Futures
- Cycles
- Volatility
- ZIGZAG
- MESA
- Retracement
- Aroon
INDICATORS LIST
LIST OF TOPICS
PRINT THIS ARTICLE
by Gary Grosschadl
Walt Disney Co. (DIS) makes a bold thrust higher as last August's high is taken out.
Position: Hold
Gary Grosschadl
Independent Canadian equities trader and technical analyst based in Peterborough
Ontario, Canada.
PRINT THIS ARTICLE
ANDREWS PITCH-FORK
Walt Disney Co. Enjoys Breakout
01/12/04 08:10:48 AMby Gary Grosschadl
Walt Disney Co. (DIS) makes a bold thrust higher as last August's high is taken out.
Position: Hold
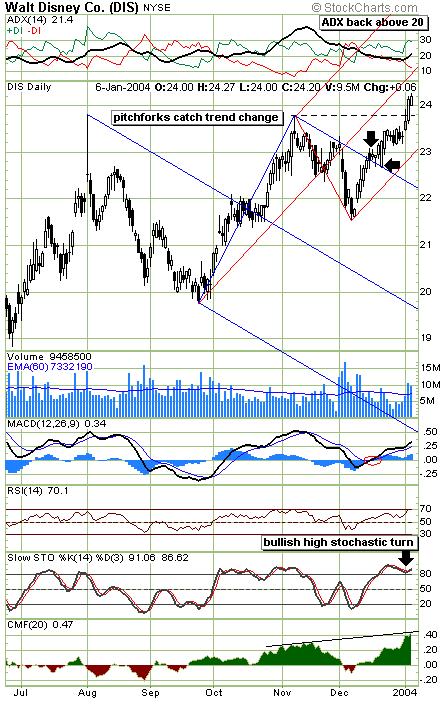
| Since the last major pivot low from below $22, a robust upleg has ensued. Chasing the stock higher gets a little dangerous now but those that are already in are in good shape. |
| Placing two pitchforks on this daily chart shows how alert traders got in at much better prices. The blue pitchfork shows the downtrend that was in effect from the last downleg. When the downleg fell short of the median line target, which was slightly below $21, it was a sign of latent bullishness that would resume the previous longer term uptrend since the lows of 2002. Pitchfork traders could assume that the top fork line would be tested again, and it was. This time the line was breached to the topside and this was a good signal that some sort of trend change was established, at least from a pitchfork point of view. Note how the line was successfully retested at the second black arrow. Breaking outside of that upper median line was the cue that the pivot points should be advanced, giving a new and bullish pointing pitchfork. |

|
| Two pitchfork views describe the action on this daily chart. |
| Graphic provided by: Stockcharts.com. |
| |
| This new pitchfork in red hints at a thrust towards the new median line. As long as this current drive stays above the lower red pitchfork line, traders are reassured that their long positions are safe while the stock tries to possibly reach the median line target. This may occur near $25. A super bullish move could entail a further drive to the top line but this, of course, remains to be seen. The median line at the center of the fork no doubt will be a trading target for many so profit taking should be anticipated. |
| Several indicators reflect this healthy drive north. The topmost indicator shows the ADX line back above the 20 level and nicely positioned between the DI lines. A good upslope for the ADX line hints at trend strength improving but some traders prefer to see an ADX level at above 25 or even 30 to show greater strength. The lower indicators also show bullishness as depicted. |
| In summary, this chart shows good bullishness but traders should stay alert, especially for signs of a reversal at or near the coming median line. A brief consolidation there could pave the way for continued bullishness, however traders should also be alert for a more serious downleg should this develop as profit takers will eventually take their pound of flesh. |
Independent Canadian equities trader and technical analyst based in Peterborough
Ontario, Canada.
| Website: | www.whatsonsale.ca/financial.html |
| E-mail address: | gwg7@sympatico.ca |
Click here for more information about our publications!
PRINT THIS ARTICLE

Request Information From Our Sponsors
- StockCharts.com, Inc.
- Candle Patterns
- Candlestick Charting Explained
- Intermarket Technical Analysis
- John Murphy on Chart Analysis
- John Murphy's Chart Pattern Recognition
- John Murphy's Market Message
- MurphyExplainsMarketAnalysis-Intermarket Analysis
- MurphyExplainsMarketAnalysis-Visual Analysis
- StockCharts.com
- Technical Analysis of the Financial Markets
- The Visual Investor
- VectorVest, Inc.
- Executive Premier Workshop
- One-Day Options Course
- OptionsPro
- Retirement Income Workshop
- Sure-Fire Trading Systems (VectorVest, Inc.)
- Trading as a Business Workshop
- VectorVest 7 EOD
- VectorVest 7 RealTime/IntraDay
- VectorVest AutoTester
- VectorVest Educational Services
- VectorVest OnLine
- VectorVest Options Analyzer
- VectorVest ProGraphics v6.0
- VectorVest ProTrader 7
- VectorVest RealTime Derby Tool
- VectorVest Simulator
- VectorVest Variator
- VectorVest Watchdog
