HOT TOPICS LIST
- MACD
- Fibonacci
- RSI
- Gann
- ADXR
- Stochastics
- Volume
- Triangles
- Futures
- Cycles
- Volatility
- ZIGZAG
- MESA
- Retracement
- Aroon
INDICATORS LIST
LIST OF TOPICS
PRINT THIS ARTICLE
by Kevin Hopson
The Nasdaq 100 Shares recently broke out of a bullish trading range, indicating the likelihood for further price appreciation in the near-term.
Position: Accumulate
Kevin Hopson
Kevin has been a technical analyst for roughly 10 years now. Previously, Kevin owned his own business and acted as a registered investment advisor, specializing in energy. He was also a freelance oil analyst for Orient Trading Co., a commodity futures trading firm in Japan. Kevin is currently a freelance writer.
PRINT THIS ARTICLE
CHANNEL LINES
Bullish Breakout For The Triple Q's
01/08/04 11:45:44 AMby Kevin Hopson
The Nasdaq 100 Shares recently broke out of a bullish trading range, indicating the likelihood for further price appreciation in the near-term.
Position: Accumulate
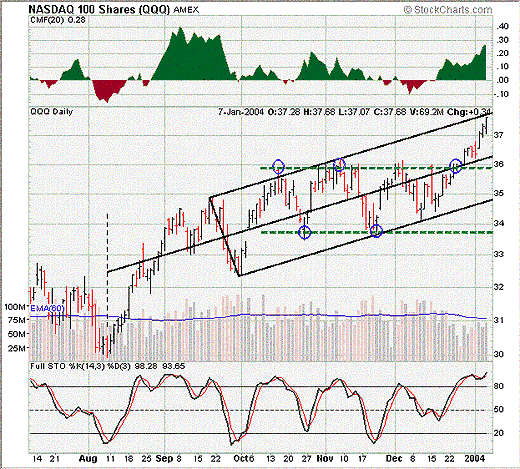
| The Nasdaq 100 shares (QQQ) - also known as the Triple Q's - broke out of a two-month trading range late last year, as illustrated by the dotted green lines. Now that this has occurred, how high will prices go? Well, if you have read any of my prior articles on trading range breakouts, you should be able to figure this out in a matter of seconds. However, for those of you who are new to the material, I will be glad to go through it again. |
| First of all, you have to figure out how many times prices tested the upper and lower channel lines in alternate sequence. I drew blue circles to better illustrate this. As you can see, the top channel line formed first. Once that occurred, prices proceeded to test the bottom and top channel lines in alternate sequence. However, not all four tests of the top channel line were circled, or counted, because the prices failed to test the bottom channel line again before breaking out. If they had, you would have counted both the third and fourth tests of the upper channel line. In any event, you have to count one of these, being that they both occurred after the double bottom formation. I chose the final (or fourth) test of the top channel line since this was the official breakout point. |

|
| Graphic provided by: Stockcharts.com. |
| |
| Once you figure out how many times prices tested the upper channel line in alternate sequence, you take that number and multiply it by the width of the trading range. When you do this [3 x ($36.00-$34.00)], you come up with $6.00. You then add this number to the bottom ($34.00 + $6.00) and top ($36.00 + $6.00) channel lines to get your price target, which is roughly $40.00 to $42.00. In other words, the Triple Q's appear to have 6 to 11 percent of additional upside in the near-term. |
| As you can see, though, the Triple Q's have been trading within the black pitchfork since October of last year. With these shares starting to reach overbought levels right now and the top black parallel line coming into play just below the $38.00 level, we could see a temporary pullback in the near-term. If so, I would look to accumulate these shares in anticipation of a move up to the $40.00 to $42.00 range. |
Kevin has been a technical analyst for roughly 10 years now. Previously, Kevin owned his own business and acted as a registered investment advisor, specializing in energy. He was also a freelance oil analyst for Orient Trading Co., a commodity futures trading firm in Japan. Kevin is currently a freelance writer.
| Glen Allen, VA | |
| E-mail address: | hopson_1@yahoo.com |
Click here for more information about our publications!
PRINT THIS ARTICLE

Request Information From Our Sponsors
- VectorVest, Inc.
- Executive Premier Workshop
- One-Day Options Course
- OptionsPro
- Retirement Income Workshop
- Sure-Fire Trading Systems (VectorVest, Inc.)
- Trading as a Business Workshop
- VectorVest 7 EOD
- VectorVest 7 RealTime/IntraDay
- VectorVest AutoTester
- VectorVest Educational Services
- VectorVest OnLine
- VectorVest Options Analyzer
- VectorVest ProGraphics v6.0
- VectorVest ProTrader 7
- VectorVest RealTime Derby Tool
- VectorVest Simulator
- VectorVest Variator
- VectorVest Watchdog
- StockCharts.com, Inc.
- Candle Patterns
- Candlestick Charting Explained
- Intermarket Technical Analysis
- John Murphy on Chart Analysis
- John Murphy's Chart Pattern Recognition
- John Murphy's Market Message
- MurphyExplainsMarketAnalysis-Intermarket Analysis
- MurphyExplainsMarketAnalysis-Visual Analysis
- StockCharts.com
- Technical Analysis of the Financial Markets
- The Visual Investor
