HOT TOPICS LIST
- MACD
- Fibonacci
- RSI
- Gann
- ADXR
- Stochastics
- Volume
- Triangles
- Futures
- Cycles
- Volatility
- ZIGZAG
- MESA
- Retracement
- Aroon
INDICATORS LIST
LIST OF TOPICS
PRINT THIS ARTICLE
by Koos van der Merwe
Ati Technology, Inc. designs, manufactures and markets multimedia solutions and graphics components for the personal computer, digital tv and consumer electronics appliance markets. Management has in the past been raked over the coals for insider trading, but hopefully the company is now clean and management is behaving.
Position: Buy
Koos van der Merwe
Has been a technical analyst since 1969, and has worked as a futures and options trader with First Financial Futures in Johannesburg, South Africa.
PRINT THIS ARTICLE
ELLIOTT WAVE
Ati Technology Inc.
01/08/04 11:02:56 AMby Koos van der Merwe
Ati Technology, Inc. designs, manufactures and markets multimedia solutions and graphics components for the personal computer, digital tv and consumer electronics appliance markets. Management has in the past been raked over the coals for insider trading, but hopefully the company is now clean and management is behaving.
Position: Buy
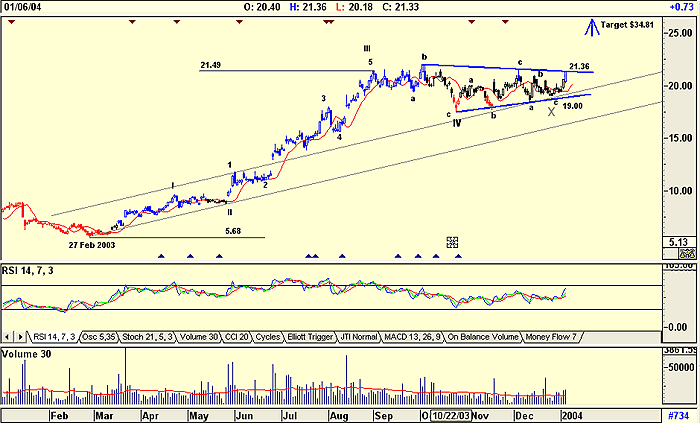
| On February 27, 2003, the share price for Ati Technologiy Inc. (ATY-T) bottomed at $5.68, falling from a high of $24.95 reached on January 4, 2002. Since then the share has recovered exceptionally well. Is it worth accumulating now? |

|
| ATI Technology, Inc. |
| Graphic provided by: AdvancedGET. |
| |
| Looking at a daily chart you can see the following: 1. An Elliott wave count that suggests the share could be tracing a rather complicated 4th wave retracement. This does look very likely as Wave II was a simple wave. Although I have shown where I believe the 4th wave ends, I have placed an "X" as an alternate low for the completion of the 4th wave. 2. I have drawn a long-term trendline from the start of Wave I and the low of Wave II. This trendline has not been violated and is still in effect. 3. I have drawn a parallel from the top of wave 1. This trendline is acting as a support level for Wave 4. 4. Finally, I have drawn what appears to be a consolidation triangle for Wave 4. This gives me a target of $34.81 should the price break out above $21.36. The target is calculated as follows: $21.49 - $5.68 = 15.81 + 19.00 = 34.81. At the present price of $21.33 and with a 10% stop-loss, my stop would be at $19.20 with a loss of $2.13. With a profit ratio of 2.5:1, I would need a profit of $5.35. My actual profit, should my target of $34.81 be reached, is $13.48. |
| I have added this company to my watch list and recommend it as a buy should the price break above $21.36. |
Has been a technical analyst since 1969, and has worked as a futures and options trader with First Financial Futures in Johannesburg, South Africa.
| Address: | 3256 West 24th Ave |
| Vancouver, BC | |
| Phone # for sales: | 6042634214 |
| E-mail address: | petroosp@gmail.com |
Click here for more information about our publications!
PRINT THIS ARTICLE

Request Information From Our Sponsors
- StockCharts.com, Inc.
- Candle Patterns
- Candlestick Charting Explained
- Intermarket Technical Analysis
- John Murphy on Chart Analysis
- John Murphy's Chart Pattern Recognition
- John Murphy's Market Message
- MurphyExplainsMarketAnalysis-Intermarket Analysis
- MurphyExplainsMarketAnalysis-Visual Analysis
- StockCharts.com
- Technical Analysis of the Financial Markets
- The Visual Investor
- VectorVest, Inc.
- Executive Premier Workshop
- One-Day Options Course
- OptionsPro
- Retirement Income Workshop
- Sure-Fire Trading Systems (VectorVest, Inc.)
- Trading as a Business Workshop
- VectorVest 7 EOD
- VectorVest 7 RealTime/IntraDay
- VectorVest AutoTester
- VectorVest Educational Services
- VectorVest OnLine
- VectorVest Options Analyzer
- VectorVest ProGraphics v6.0
- VectorVest ProTrader 7
- VectorVest RealTime Derby Tool
- VectorVest Simulator
- VectorVest Variator
- VectorVest Watchdog
