HOT TOPICS LIST
- MACD
- Fibonacci
- RSI
- Gann
- ADXR
- Stochastics
- Volume
- Triangles
- Futures
- Cycles
- Volatility
- ZIGZAG
- MESA
- Retracement
- Aroon
INDICATORS LIST
LIST OF TOPICS
PRINT THIS ARTICLE
by Ashwani Gujral
Sideways markets are tedious to trade but finally the Nasdaq has broken out of a sideways market and is heading to 2700.
Position: N/A
Ashwani Gujral
He is founder of AGIP Securities Pvt. Ltd. which offers money management services, live chat rooms (during market hours) and independent technical analysis consultancy. The company has a big media presence from the likes of CNBC, NDTV Profit, and ZEE Business.
PRINT THIS ARTICLE
CONSOLID FORMATION
Nasdaq Headed To 2700
01/12/04 10:37:46 AMby Ashwani Gujral
Sideways markets are tedious to trade but finally the Nasdaq has broken out of a sideways market and is heading to 2700.
Position: N/A
| The Nasdaq moved to new highs yesterday (January 6, 2004), closing at 2057. The Nasdaq has been consolidated between 1260 to 2000 since September and seems to have broken out from this trading range, as shown on the weekly chart. The index now seems headed towards 2700. Which sectors are helping the Nasdaq to break out of this long consolidation? You can find out by tracking the various sector indexes, then looking for the strongest stocks in those sectors. They should be breaking out into new two- and three-year highs. These stocks will be the outperformers if the Nasdaq continues to rally. |
| A lot of people have been skeptical about a rally in the Nasdaq, citing various reasons such as valuations and the uneven growth in the economy. Some have even declared the Nasdaq has topped out. But the charts are saying something else. Such skepticism is healthy at the beginning of any new move and will only help fuel the new trend. |

|
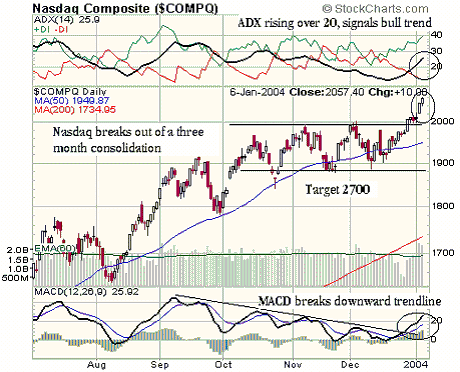
| Figure 1: Daily chart of the Nasdaq Composite. |
| Graphic provided by: Stockcharts.com. |
| |
| In the daily chart, the Nasdaq has broken out of a sideways consolidation and has now decisively closed over the top of the trading range. The ADX is rising over 20 and is showing signs of a strengthening uptrend. The MACD has broken its downtrend and is now headed upwards. It is now clear that the sideways move was a consolidation and not distribution. Using the consolidation, I have arrived at a target of 2700 by adding the move prior to the consolidation, from about 1260 to 2000 to the consolidation's lower end. |
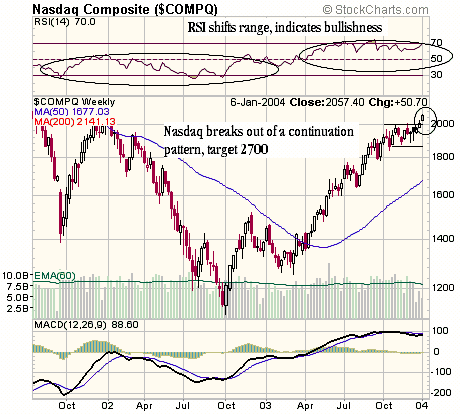
| The weekly chart shows the sideways pattern was a consolidation and the trend is likely to continue. The RSI continues its bullish stance. The weekly MACD is flattish indicating a consolidation and should soon break out. The Nasdaq now needs another weekly closing over 2000 for confirmation of the weekly trend. This should happen as a lot of sectors in the Nasdaq are breaking out of sideways consolidation and moving into new two- and three-year highs. The bullishness of this index is likely to rub off on many sectors in the technology area. As technical analysis is about probabilities, the breakout of a major index would add hugely to the strong sectors in it, increasing the probability of making money in the stocks in those sectors. |
 Figure 2: Weekly chart of the Nasdaq. |
He is founder of AGIP Securities Pvt. Ltd. which offers money management services, live chat rooms (during market hours) and independent technical analysis consultancy. The company has a big media presence from the likes of CNBC, NDTV Profit, and ZEE Business.
| Title: | Chief mkt strategist |
| Company: | AGIP Securities |
| India | |
| Phone # for sales: | 9871066337 |
| Website: | www.ashwanigujral.com |
| E-mail address: | contact@ashwanigujral.com |
Traders' Resource Links | |
| AGIP Securities has not added any product or service information to TRADERS' RESOURCE. | |
Click here for more information about our publications!
PRINT THIS ARTICLE

Request Information From Our Sponsors
- StockCharts.com, Inc.
- Candle Patterns
- Candlestick Charting Explained
- Intermarket Technical Analysis
- John Murphy on Chart Analysis
- John Murphy's Chart Pattern Recognition
- John Murphy's Market Message
- MurphyExplainsMarketAnalysis-Intermarket Analysis
- MurphyExplainsMarketAnalysis-Visual Analysis
- StockCharts.com
- Technical Analysis of the Financial Markets
- The Visual Investor
- VectorVest, Inc.
- Executive Premier Workshop
- One-Day Options Course
- OptionsPro
- Retirement Income Workshop
- Sure-Fire Trading Systems (VectorVest, Inc.)
- Trading as a Business Workshop
- VectorVest 7 EOD
- VectorVest 7 RealTime/IntraDay
- VectorVest AutoTester
- VectorVest Educational Services
- VectorVest OnLine
- VectorVest Options Analyzer
- VectorVest ProGraphics v6.0
- VectorVest ProTrader 7
- VectorVest RealTime Derby Tool
- VectorVest Simulator
- VectorVest Variator
- VectorVest Watchdog
