HOT TOPICS LIST
- MACD
- Fibonacci
- RSI
- Gann
- ADXR
- Stochastics
- Volume
- Triangles
- Futures
- Cycles
- Volatility
- ZIGZAG
- MESA
- Retracement
- Aroon
INDICATORS LIST
LIST OF TOPICS
PRINT THIS ARTICLE
by Ashwani Gujral
Traders should always be wary of trading patterns before they breakout/breakdown because failed patterns can lead to large moves in the opposite direction. In this article, I will demonstrate how a failed head and shoulders in oil may now be leading to a much higher move.
Position: N/A
Ashwani Gujral
He is founder of AGIP Securities Pvt. Ltd. which offers money management services, live chat rooms (during market hours) and independent technical analysis consultancy. The company has a big media presence from the likes of CNBC, NDTV Profit, and ZEE Business.
PRINT THIS ARTICLE
HEAD & SHOULDERS
Is Oil Headed Back Up?
01/13/04 08:03:25 AMby Ashwani Gujral
Traders should always be wary of trading patterns before they breakout/breakdown because failed patterns can lead to large moves in the opposite direction. In this article, I will demonstrate how a failed head and shoulders in oil may now be leading to a much higher move.
Position: N/A
| Inexperienced traders may be taken in by what looks like a classical technical pattern, such as a head and shoulders pattern that seems to be breaking out or breaking down in the right direction. Then, only a few sessions later the price, instead of breaking up/down in the usual direction, turns back and breaks in the opposite direction. This is called a failed pattern. These failed patterns can potentially lead to powerful moves in the opposite direction as those traders who try to position themselves before the actual breakout are trapped. Traders need to remember that technical analysis needs confirmation. |
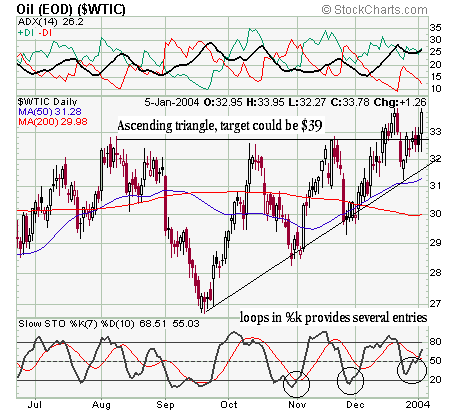
| The daily chart of oil below, shows a normal ascending triangle trying to break out upwards. The slow stochastic, set at 7%K and 10%D, provides several entries. The target for this ascending triangle can be $39. The ADX is not as strong as I would like but is starting to move up again. |

|
| Figure 1: Daily chart for oil. |
| Graphic provided by: Stockcharts.com. |
| |
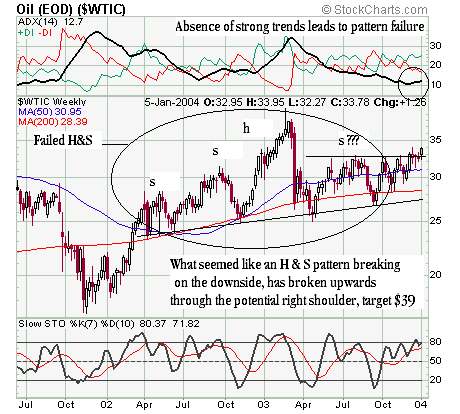
| In technical analysis remember that events and fundamentals determine charts and not the other way around. Now look at the weekly chart of oil. The events over the last few months are as follows: Oil hit a high of about $40 before the war in Iraq. It came down sharply when the U.S. led forces made sure of victory in Iraq. Hence the price started forming a topping out head and shoulders pattern. But over the next few months with the violence in the Middle East looking like it wasn't going to end and the severe cold expected to hit the U.S., oil started moving back up before it broke the neckline of the bearish head and shoulders. The price then broke upwards through the potential right shoulder, which lead to a failure of the pattern. Since the price level of the right shoulder is generally taken as the stop, it is likely if prices go through it, a lot of short covering or cutting of positions can be expected as well. |
 Figure 2: Weekly chart of oil. In a head and shoulders pattern it is key that a breakout or a breakdown be confirmed by a couple of price closings above or below the neckline, respectively. When this doesn't happen and the prices go in the opposite direction through the preceding right shoulder, the head and shoulders has failed. Patterns failures are common in real world technical analysis and happen all the time. The literature on technical analysis often focuses on successful patterns but traders should remember these patterns do have failure rates. |
| These pattern failures cannot be avoided but can reduced in number by confirmation on two time frames. In this case the patterns in daily and weekly charts were contradictory. The other way of avoiding failures is to confirm movement with the ADX. It should indicate a trend and support the direction of the breakout/breakdown. Pattern failures occur frequently in non-trending markets. Now back to oil, the weekly chart has broken to the upside, with the minimum target at $39. Now the breakout is supported on both the daily and the weekly charts. |
He is founder of AGIP Securities Pvt. Ltd. which offers money management services, live chat rooms (during market hours) and independent technical analysis consultancy. The company has a big media presence from the likes of CNBC, NDTV Profit, and ZEE Business.
| Title: | Chief mkt strategist |
| Company: | AGIP Securities |
| India | |
| Phone # for sales: | 9871066337 |
| Website: | www.ashwanigujral.com |
| E-mail address: | contact@ashwanigujral.com |
Traders' Resource Links | |
| AGIP Securities has not added any product or service information to TRADERS' RESOURCE. | |
Click here for more information about our publications!
PRINT THIS ARTICLE

Request Information From Our Sponsors
- StockCharts.com, Inc.
- Candle Patterns
- Candlestick Charting Explained
- Intermarket Technical Analysis
- John Murphy on Chart Analysis
- John Murphy's Chart Pattern Recognition
- John Murphy's Market Message
- MurphyExplainsMarketAnalysis-Intermarket Analysis
- MurphyExplainsMarketAnalysis-Visual Analysis
- StockCharts.com
- Technical Analysis of the Financial Markets
- The Visual Investor
- VectorVest, Inc.
- Executive Premier Workshop
- One-Day Options Course
- OptionsPro
- Retirement Income Workshop
- Sure-Fire Trading Systems (VectorVest, Inc.)
- Trading as a Business Workshop
- VectorVest 7 EOD
- VectorVest 7 RealTime/IntraDay
- VectorVest AutoTester
- VectorVest Educational Services
- VectorVest OnLine
- VectorVest Options Analyzer
- VectorVest ProGraphics v6.0
- VectorVest ProTrader 7
- VectorVest RealTime Derby Tool
- VectorVest Simulator
- VectorVest Variator
- VectorVest Watchdog
