HOT TOPICS LIST
- MACD
- Fibonacci
- RSI
- Gann
- ADXR
- Stochastics
- Volume
- Triangles
- Futures
- Cycles
- Volatility
- ZIGZAG
- MESA
- Retracement
- Aroon
INDICATORS LIST
LIST OF TOPICS
PRINT THIS ARTICLE
by Ashwani Gujral
Leading sectors from a preceding bull market are often decimated in the subsequent bear market. The telecommunications sector was sent reeling in the technology crash. But they've been making exciting moves recently. Let's see what the possible targets could be.
Position: N/A
Ashwani Gujral
He is founder of AGIP Securities Pvt. Ltd. which offers money management services, live chat rooms (during market hours) and independent technical analysis consultancy. The company has a big media presence from the likes of CNBC, NDTV Profit, and ZEE Business.
PRINT THIS ARTICLE
REVERSAL
Telecommunications Starting To Trend?
01/09/04 12:41:42 PMby Ashwani Gujral
Leading sectors from a preceding bull market are often decimated in the subsequent bear market. The telecommunications sector was sent reeling in the technology crash. But they've been making exciting moves recently. Let's see what the possible targets could be.
Position: N/A
| Bear markets are notorious for putting nonviable enterprises out of business. They also tend to be equalizers -- the sector that put on the maximum fat in the preceding bull market will get the maximum trimming. These sectors are often forgotten for a few years until they sort out their troubles, with only the best companies surviving. Telecommunications are one such sector. High fliers in the technology boom, they've been forgotten for the last three years. This sector has formed a long basing pattern and is now beginning to break out. They could be the classic contrarian bet right now. |
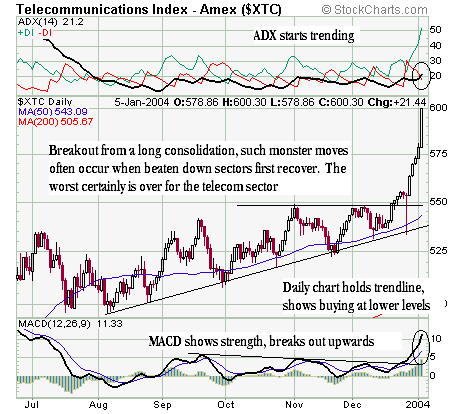
| On the daily chart the telecommunications index ($XTC) listed on AMEX shows a monster move breaking upwards in the form of an ascending triangle. The preceding move was clearly a longish consolidation/accumulation pattern. Currently, the ADX has started moving over 20, another sign that an upward trend is beginning. The MACD, which was flattish and had declining tops, has reversed and broken upwards, indicating an uptrend as well. |

|
| Figure 1: Daily chart of Telecommunications index. |
| Graphic provided by: Stockcharts.com. |
| |
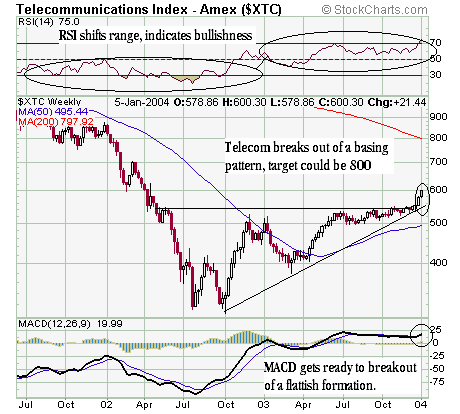
| The weekly chart shows even more interesting patterns. The telecommunications sector bottomed out over this period, forming an ascending triangle. This process may be complete now. I would caution novice traders not to get carried away by all the colorful names of these formations. The key is to understand the market action behind the patterns. A bottoming out pattern generally has a horizontal supply line and a rising trendline, showing increasing demand, until the horizontal supply line finally breaks and prices shoot upwards. An indication of higher closing prices would be a shift in the RSI. For $XTC, the RSI now has bullish indications. A look at the flat weekly MACD shows that it was in a consolidation mode and should now break decisively upwards. |
 Figure 2: Weekly chart of the Telecommunications index. In this article, I've shown that the telecommunications sector is bottoming out. Traders can now look for the strongest stocks in that sector and ride moves that could be two to three times the current prices. Following various sector and market indexes is key to technical analysis. Money is always made in the strongest sectors of the market and in the strongest stocks. A top down approach helps traders identify the stocks that are most likely to move up. |
He is founder of AGIP Securities Pvt. Ltd. which offers money management services, live chat rooms (during market hours) and independent technical analysis consultancy. The company has a big media presence from the likes of CNBC, NDTV Profit, and ZEE Business.
| Title: | Chief mkt strategist |
| Company: | AGIP Securities |
| India | |
| Phone # for sales: | 9871066337 |
| Website: | www.ashwanigujral.com |
| E-mail address: | contact@ashwanigujral.com |
Traders' Resource Links | |
| AGIP Securities has not added any product or service information to TRADERS' RESOURCE. | |
Click here for more information about our publications!
PRINT THIS ARTICLE

Request Information From Our Sponsors
- StockCharts.com, Inc.
- Candle Patterns
- Candlestick Charting Explained
- Intermarket Technical Analysis
- John Murphy on Chart Analysis
- John Murphy's Chart Pattern Recognition
- John Murphy's Market Message
- MurphyExplainsMarketAnalysis-Intermarket Analysis
- MurphyExplainsMarketAnalysis-Visual Analysis
- StockCharts.com
- Technical Analysis of the Financial Markets
- The Visual Investor
- VectorVest, Inc.
- Executive Premier Workshop
- One-Day Options Course
- OptionsPro
- Retirement Income Workshop
- Sure-Fire Trading Systems (VectorVest, Inc.)
- Trading as a Business Workshop
- VectorVest 7 EOD
- VectorVest 7 RealTime/IntraDay
- VectorVest AutoTester
- VectorVest Educational Services
- VectorVest OnLine
- VectorVest Options Analyzer
- VectorVest ProGraphics v6.0
- VectorVest ProTrader 7
- VectorVest RealTime Derby Tool
- VectorVest Simulator
- VectorVest Variator
- VectorVest Watchdog
