HOT TOPICS LIST
- MACD
- Fibonacci
- RSI
- Gann
- ADXR
- Stochastics
- Volume
- Triangles
- Futures
- Cycles
- Volatility
- ZIGZAG
- MESA
- Retracement
- Aroon
INDICATORS LIST
LIST OF TOPICS
PRINT THIS ARTICLE
by Gary Grosschadl
Last month gold finally closed above $400, something it hasn't done since 1996.
Position: Hold
Gary Grosschadl
Independent Canadian equities trader and technical analyst based in Peterborough
Ontario, Canada.
PRINT THIS ARTICLE
CHART ANALYSIS
Long Term Gold Hitting Resistance
01/06/04 10:20:28 AMby Gary Grosschadl
Last month gold finally closed above $400, something it hasn't done since 1996.
Position: Hold
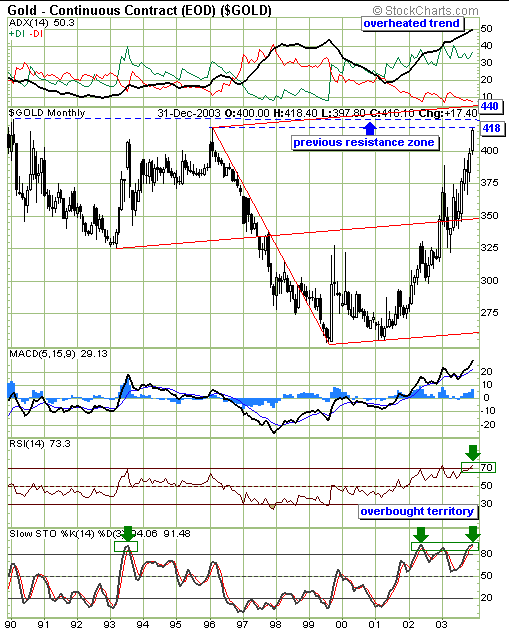
| The monthly chart for gold shows the dramatic run from double bottom lows near $255 in 1999 and 2001. Placing a pitchork (or Andrews Line) on the chart illustrates this dramatic move and aptly tells the story. A classic pitchfork move is a run to the median line. A very bullish move is a further run towards the upper line and this certainly seems to be the case here, but not before some wild gyrations at the $350 mark. Should the top line be touched, then a spike up to $440 or close to it could be in the cards. However looking back at previous tops at $418 and $425, a case can be made for the gold price to possibly balk in this resistance zone. |

|
| Long term gold chart shows previous resistance. |
| Graphic provided by: Stockcharts.com. |
| |
| Several indicators are also pointing at a possible topping out in the near future. The DMI or directional movement indicator on the top of the chart shows the ADX component clearly in overheated mode. The ADX shows trend strength at record levels at 50.3. A downturn from these high levels will coincide with the ending of the current trend, meaning a downleg will develope. The MACD (moving average convergence/divergence) is still in a bullish mode but note that it also is in record high territory. Likewise the RSI (relative strength index) and the stochastics are in overbought territory. |
| This chart is still bullish but with the price hitting this previous resistance zone, I can readily imagine the big money players dancing close to the exits. Whether the exit comes here or nearer to $440, dancing close to the exits seems to be a prudent plan. |
Independent Canadian equities trader and technical analyst based in Peterborough
Ontario, Canada.
| Website: | www.whatsonsale.ca/financial.html |
| E-mail address: | gwg7@sympatico.ca |
Click here for more information about our publications!
PRINT THIS ARTICLE

Request Information From Our Sponsors
- StockCharts.com, Inc.
- Candle Patterns
- Candlestick Charting Explained
- Intermarket Technical Analysis
- John Murphy on Chart Analysis
- John Murphy's Chart Pattern Recognition
- John Murphy's Market Message
- MurphyExplainsMarketAnalysis-Intermarket Analysis
- MurphyExplainsMarketAnalysis-Visual Analysis
- StockCharts.com
- Technical Analysis of the Financial Markets
- The Visual Investor
- VectorVest, Inc.
- Executive Premier Workshop
- One-Day Options Course
- OptionsPro
- Retirement Income Workshop
- Sure-Fire Trading Systems (VectorVest, Inc.)
- Trading as a Business Workshop
- VectorVest 7 EOD
- VectorVest 7 RealTime/IntraDay
- VectorVest AutoTester
- VectorVest Educational Services
- VectorVest OnLine
- VectorVest Options Analyzer
- VectorVest ProGraphics v6.0
- VectorVest ProTrader 7
- VectorVest RealTime Derby Tool
- VectorVest Simulator
- VectorVest Variator
- VectorVest Watchdog
