HOT TOPICS LIST
- MACD
- Fibonacci
- RSI
- Gann
- ADXR
- Stochastics
- Volume
- Triangles
- Futures
- Cycles
- Volatility
- ZIGZAG
- MESA
- Retracement
- Aroon
INDICATORS LIST
LIST OF TOPICS
PRINT THIS ARTICLE
by Ashwani Gujral
Ascending triangles are different from other triangles. They give an indication of the direction of their breakout before the event. An ascending triangle breakout on heavy volume is a good reason to be long on a stock and CompuDyne Corporation's chart gives you just such a formation.
Position: Buy
Ashwani Gujral
He is founder of AGIP Securities Pvt. Ltd. which offers money management services, live chat rooms (during market hours) and independent technical analysis consultancy. The company has a big media presence from the likes of CNBC, NDTV Profit, and ZEE Business.
PRINT THIS ARTICLE
TRIANGLES
CompuDyne Corporation Breaks Out Of An Ascending Triangle
01/08/04 01:54:01 PMby Ashwani Gujral
Ascending triangles are different from other triangles. They give an indication of the direction of their breakout before the event. An ascending triangle breakout on heavy volume is a good reason to be long on a stock and CompuDyne Corporation's chart gives you just such a formation.
Position: Buy
| One of the easiest patterns in classical technical analysis is the ascending triangle reversal pattern. The pattern has a horizontal line which can be called a seller's line and an upward sloping line called the buyer's line. The buyers keep bidding up the buying price, along the upward sloping line as they meet resistance along the horizontal line, until the price finally breaks out of the horizontal line on heavy volume. The minimum target for this pattern is the width of the ascending triangle at its widest point. A pullback bringing prices back to the horizontal line may or may not occur after the breakout. A stop can be placed at the previous lower pivot for long trades. |

|
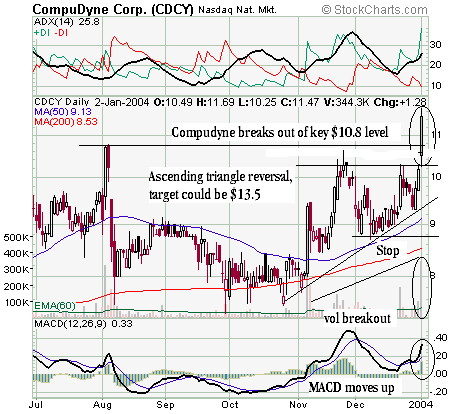
| Figure 1: Daily chart for Compudyne. |
| Graphic provided by: Stockcharts.com. |
| |
| Compudyne's daily chart shows an ascending triangle breakout occurring at $10.20. It has an upward target of $14.50 and the stop can be placed at the $8.80 level. The ADX is rising above the 20 level, showing the beginning of a trend on the daily time frame. The breakout is also confirmed by high volume. The MACD also breaks upwards from a flattish formation, showing the stock is breaking out of consolidation. The stock may or may not retrace to $10.20 but should stay above its pivot support at $8.80. |
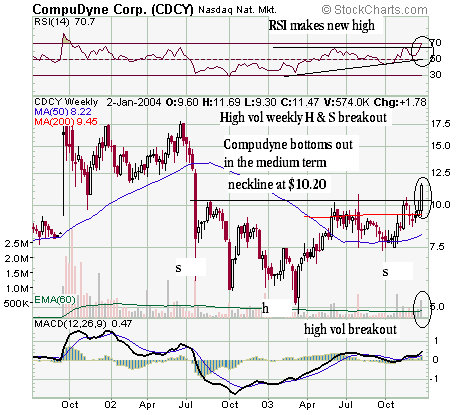
 Figure 2: Weekly chart of CompuDyne. Now, look at the weekly chart to see how the ascending triangle fits into the larger picture. Here Compudyne stock has bottomed out in a head and shoulders formation and broken out at $10.20. The target of this head and shoulders is $15. The weekly RSI has also broken out to a new high, confirming the strength of the stock. The stock is now comfortably trading above its long term moving averages, such as the 50-week SMA and the 200-week SMA. I therefore conclude that both the charts are confirming a bullish stance on the stock. |
He is founder of AGIP Securities Pvt. Ltd. which offers money management services, live chat rooms (during market hours) and independent technical analysis consultancy. The company has a big media presence from the likes of CNBC, NDTV Profit, and ZEE Business.
| Title: | Chief mkt strategist |
| Company: | AGIP Securities |
| India | |
| Phone # for sales: | 9871066337 |
| Website: | www.ashwanigujral.com |
| E-mail address: | contact@ashwanigujral.com |
Traders' Resource Links | |
| AGIP Securities has not added any product or service information to TRADERS' RESOURCE. | |
Click here for more information about our publications!
Comments

Request Information From Our Sponsors
- StockCharts.com, Inc.
- Candle Patterns
- Candlestick Charting Explained
- Intermarket Technical Analysis
- John Murphy on Chart Analysis
- John Murphy's Chart Pattern Recognition
- John Murphy's Market Message
- MurphyExplainsMarketAnalysis-Intermarket Analysis
- MurphyExplainsMarketAnalysis-Visual Analysis
- StockCharts.com
- Technical Analysis of the Financial Markets
- The Visual Investor
- VectorVest, Inc.
- Executive Premier Workshop
- One-Day Options Course
- OptionsPro
- Retirement Income Workshop
- Sure-Fire Trading Systems (VectorVest, Inc.)
- Trading as a Business Workshop
- VectorVest 7 EOD
- VectorVest 7 RealTime/IntraDay
- VectorVest AutoTester
- VectorVest Educational Services
- VectorVest OnLine
- VectorVest Options Analyzer
- VectorVest ProGraphics v6.0
- VectorVest ProTrader 7
- VectorVest RealTime Derby Tool
- VectorVest Simulator
- VectorVest Variator
- VectorVest Watchdog
