

HOT TOPICS LIST
- MACD
- Fibonacci
- RSI
- Gann
- ADXR
- Stochastics
- Volume
- Triangles
- Futures
- Cycles
- Volatility
- ZIGZAG
- MESA
- Retracement
- Aroon
INDICATORS LIST
LIST OF TOPICS
PRINT THIS ARTICLE
by Kevin Hopson
The Houston Exploration Co. has been consolidating in a bullish trading range since last September, indicating the potential for higher prices down the road.
Position: Accumulate
Kevin Hopson
Kevin has been a technical analyst for roughly 10 years now. Previously, Kevin owned his own business and acted as a registered investment advisor, specializing in energy. He was also a freelance oil analyst for Orient Trading Co., a commodity futures trading firm in Japan. Kevin is currently a freelance writer.
PRINT THIS ARTICLE
CHANNEL LINES
Houston Exploration's Bullish Trading Range
01/06/04 11:20:23 AMby Kevin Hopson
The Houston Exploration Co. has been consolidating in a bullish trading range since last September, indicating the potential for higher prices down the road.
Position: Accumulate
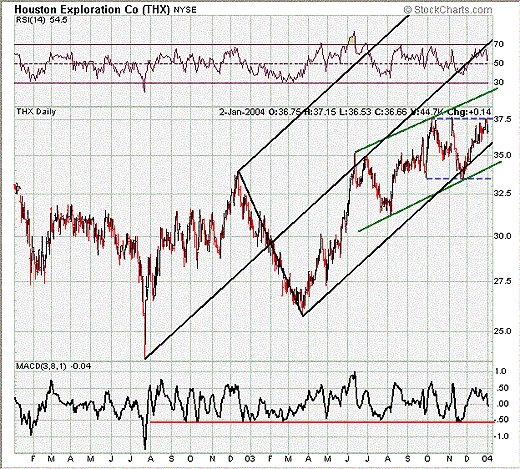
| The Houston Exploration Co. (THX) is engaged in the exploration and production of oil and natural gas, with natural gas making up over 90 percent of the company's net proved reserves. The company operates primarily in south Texas, the Gulf of Mexico (offshore), and the Arkoma Basin of Arkansas and Oklahoma. As you can see in the two-year chart, Houston Exploration has been in a pretty strong uptrend since March of last year (2003). This is better illustrated by the black pitchfork, which shows the stock's consistent rise within the lower channel formation. |
| However, since last September, the stock has been moving sideways between the $33.50 and $37.50 levels, effectively forming a bullish trading range. A bullish trading range is basically a rectangle (or sideways channel) formation that develops after a strong move up. Since trading ranges tend to be continuation patterns and Houston Exploration is in a clear uptrend, the logical break would be to the upside. As of right now, an upside breakout would indicate a potential price target of between $41.50 and $45.50. For information on how to calculate price targets based on trading range breakouts, please refer to prior articles of mine on this subject. |
|
| Graphic provided by: Stockcharts.com. |
| |
| In anticipation of a move higher, I would look to accumulate shares of Houston Exploration in the near-term. More specifically, I would look for potential support in the $33.50 to $36.00 range. The $35.50 to $36.00 range is the site of the bottom black parallel line and the stock's 50-day moving average ($35.60), while the $34.00 to $34.50 range is the site of August's uptrend line. Additionally, the $33.50 level is the site of the lower channel line (or the bottom of the current trading range). |
| Since the stock's 200-day moving average ($33.12) is not far below and should eventually catch up to this level, $33.50 should act as ultimate support during a pullback. You will also want to keep an eye on the moving average convergence/divergence (MACD). For example, notice that the stock has bottomed out every time the MACD reading has approached -.50 since September 2002. As a result, if prices pull back to one of the previously mentioned support levels and the MACD is around -.50, it could be an excellent time to buy. |
Kevin has been a technical analyst for roughly 10 years now. Previously, Kevin owned his own business and acted as a registered investment advisor, specializing in energy. He was also a freelance oil analyst for Orient Trading Co., a commodity futures trading firm in Japan. Kevin is currently a freelance writer.
| Glen Allen, VA | |
| E-mail address: | hopson_1@yahoo.com |
Click here for more information about our publications!
PRINT THIS ARTICLE

Request Information From Our Sponsors
- StockCharts.com, Inc.
- Candle Patterns
- Candlestick Charting Explained
- Intermarket Technical Analysis
- John Murphy on Chart Analysis
- John Murphy's Chart Pattern Recognition
- John Murphy's Market Message
- MurphyExplainsMarketAnalysis-Intermarket Analysis
- MurphyExplainsMarketAnalysis-Visual Analysis
- StockCharts.com
- Technical Analysis of the Financial Markets
- The Visual Investor
- VectorVest, Inc.
- Executive Premier Workshop
- One-Day Options Course
- OptionsPro
- Retirement Income Workshop
- Sure-Fire Trading Systems (VectorVest, Inc.)
- Trading as a Business Workshop
- VectorVest 7 EOD
- VectorVest 7 RealTime/IntraDay
- VectorVest AutoTester
- VectorVest Educational Services
- VectorVest OnLine
- VectorVest Options Analyzer
- VectorVest ProGraphics v6.0
- VectorVest ProTrader 7
- VectorVest RealTime Derby Tool
- VectorVest Simulator
- VectorVest Variator
- VectorVest Watchdog