HOT TOPICS LIST
- MACD
- Fibonacci
- RSI
- Gann
- ADXR
- Stochastics
- Volume
- Triangles
- Futures
- Cycles
- Volatility
- ZIGZAG
- MESA
- Retracement
- Aroon
INDICATORS LIST
LIST OF TOPICS
PRINT THIS ARTICLE
by Ashwani Gujral
Symmetrical triangles are indecisive and difficult patterns to trade. China Unicom seems to have broken out of one, but keep the caveat in mind.
Position: Buy
Ashwani Gujral
He is founder of AGIP Securities Pvt. Ltd. which offers money management services, live chat rooms (during market hours) and independent technical analysis consultancy. The company has a big media presence from the likes of CNBC, NDTV Profit, and ZEE Business.
PRINT THIS ARTICLE
SYMMETRICAL TRIANGLE
Is China Unicom Breaking Out?
01/06/04 11:14:59 AMby Ashwani Gujral
Symmetrical triangles are indecisive and difficult patterns to trade. China Unicom seems to have broken out of one, but keep the caveat in mind.
Position: Buy
| Symmetrical triangles are possibly the most indecisive pattern out of all technical patterns. Most break out in the direction of the original trend, but some reverse long-term trends and this possibility should always be kept in mind. A symmetrical triangle is a sideways price area or trading range whose top can be defined by a downward sloping line and whose bottom can be connected by an upward sloping line. While the sideways action is occuring, it is characterized by diminishing volume. The price action in a symmetrical triangle is often described as a coil or spring which winds tighter and tighter, finally snapping free. The prices on breakout or breakdown from these symmetrical triangles give sizable tradable moves. The point where the upward and downward sloping lines meet is called the apex of the triangle. This is often a point of support or resistance once the breakout/breakdown occurs. |
| I always like to see big volume on a breakout. Low volume breakouts often lead to price action which ends up making a larger triangle in the same spot. Triangle breakouts/breakdowns often correct back towards the apex of the triangle, which acts as support or resistance and provides a low risk entry. If a triangle breakout fails to hold the apex of the triangle, it often means pattern failure and can lead to large move in the opposite direction. Trading them before a confirmed breakout could be hazardous. Look for as much confirmation as possible before entering a trade. Additional confirmation often comes from charting the stock on a larger time frame. |

|
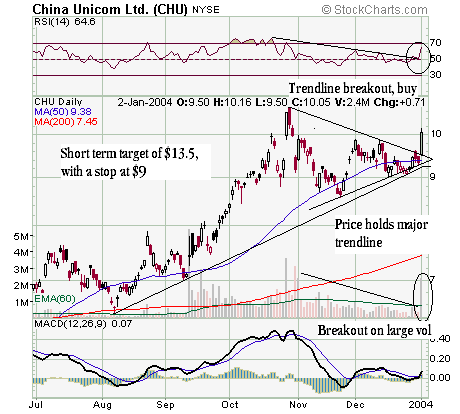
| Figure 1: Daily chart of China Unicom. |
| Graphic provided by: Stockcharts.com. |
| |
| In this article I will analyze China Unicom's symmetrical triangle breakout that occurred on January 2, 2004. The symmetrical triangle broke out at $9.50 on heavy volume. The breakout was preceded by low volume sideways action. This triangle seems to be a consolidation formation as it has broken out in the original direction. Hence its target will be a move similar in size to the one preceding the triangle. If this were a reversal pattern, its target would be the width of the triangle. The price has held a long-term upward sloping trendline, which should act as support and a stop for long trades. A trendline breakout on the RSI has also given a buy signal. |
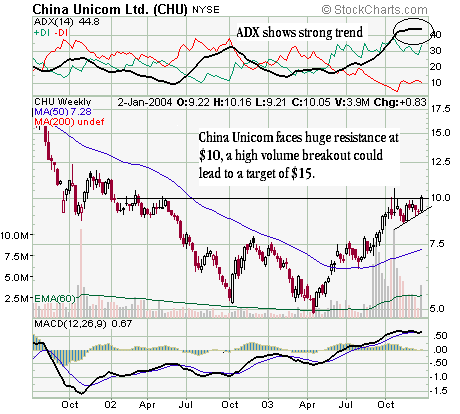
 Figure 2: Weekly chart of China Unicom. I do not consider the above as a confirmation. I would like to see the price sustain $10 for a couple of sessions as indicated on the weekly chart. After a breakout from a symmetrical triangle the price often retraces to the apex point. I would buy once the apex area is tested. If there is one pattern to be cautious about, this is it. Once the initial tentativeness is over, it generally gives a large move. Now, look at the weekly chart to get additional confirmation. As you can see, the $10 level has acted as major resistance in the past. A heavy volume breakout is desirable in this case. Also the ADX shows the stock is in a strong trend and this increases the probability of sustaining the breakout. A medium-term target of $15 is a good possibility given that the stock has consolidated between $5 and $10 for a long time. |
He is founder of AGIP Securities Pvt. Ltd. which offers money management services, live chat rooms (during market hours) and independent technical analysis consultancy. The company has a big media presence from the likes of CNBC, NDTV Profit, and ZEE Business.
| Title: | Chief mkt strategist |
| Company: | AGIP Securities |
| India | |
| Phone # for sales: | 9871066337 |
| Website: | www.ashwanigujral.com |
| E-mail address: | contact@ashwanigujral.com |
Traders' Resource Links | |
| AGIP Securities has not added any product or service information to TRADERS' RESOURCE. | |
Click here for more information about our publications!
Comments

Request Information From Our Sponsors
- StockCharts.com, Inc.
- Candle Patterns
- Candlestick Charting Explained
- Intermarket Technical Analysis
- John Murphy on Chart Analysis
- John Murphy's Chart Pattern Recognition
- John Murphy's Market Message
- MurphyExplainsMarketAnalysis-Intermarket Analysis
- MurphyExplainsMarketAnalysis-Visual Analysis
- StockCharts.com
- Technical Analysis of the Financial Markets
- The Visual Investor
- VectorVest, Inc.
- Executive Premier Workshop
- One-Day Options Course
- OptionsPro
- Retirement Income Workshop
- Sure-Fire Trading Systems (VectorVest, Inc.)
- Trading as a Business Workshop
- VectorVest 7 EOD
- VectorVest 7 RealTime/IntraDay
- VectorVest AutoTester
- VectorVest Educational Services
- VectorVest OnLine
- VectorVest Options Analyzer
- VectorVest ProGraphics v6.0
- VectorVest ProTrader 7
- VectorVest RealTime Derby Tool
- VectorVest Simulator
- VectorVest Variator
- VectorVest Watchdog
