HOT TOPICS LIST
- MACD
- Fibonacci
- RSI
- Gann
- ADXR
- Stochastics
- Volume
- Triangles
- Futures
- Cycles
- Volatility
- ZIGZAG
- MESA
- Retracement
- Aroon
INDICATORS LIST
LIST OF TOPICS
PRINT THIS ARTICLE
by Ashwani Gujral
The Nikkei seems to have bottomed out for a while; look to enter a breakout for a decent move.
Position: N/A
Ashwani Gujral
He is founder of AGIP Securities Pvt. Ltd. which offers money management services, live chat rooms (during market hours) and independent technical analysis consultancy. The company has a big media presence from the likes of CNBC, NDTV Profit, and ZEE Business.
PRINT THIS ARTICLE
HEAD & SHOULDERS
Is It Time To Keep An Eye On The Nikkei?
01/08/04 01:49:03 PMby Ashwani Gujral
The Nikkei seems to have bottomed out for a while; look to enter a breakout for a decent move.
Position: N/A
| Japan has been in a depression for the better part of the last 15 years. The Nikkei index has fallen relentlessly from 36,000 to less than 8,000. A generation of traders have almost given up on Japan. While the Nikkei index has not done much in the last two or three years, I will analyze what Japan has been doing during that same time period. Also I would like to show the difficulty of trading non-trending markets (as defined by having an ADX less than 30), and why they should be avoided. |
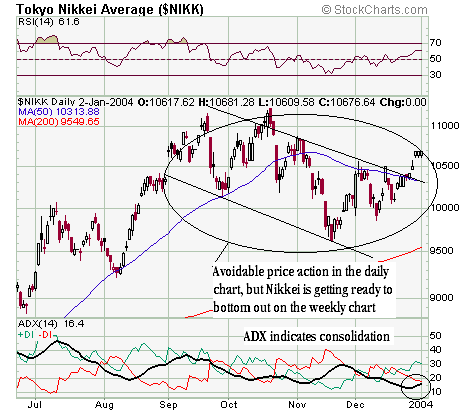
| Looking at the RSI and ADX on the Nikkei daily chart, you can see the price action is extremely choppy, making for a very difficult market to trade. With an ADX less than 30, this market has done nothing for three or four months whereas other markets have been buoyant. This is not a good market for those trading in a daily time frame. On the other hand, an intraday trader might find trending moves in his time frame. So the only people making money on the Nikkei are extremely short-term traders. But it is critical to understand how the current action is helping the weekly chart. Traders on a daily time frame should wait for the index to break out of its consolidation on heavy volume and to stay above 11,000. |

|
| Figure 1: Daily Nikkei chart. |
| Graphic provided by: Stockcharts.com. |
| |
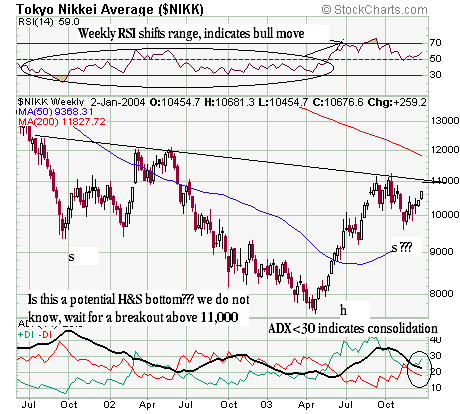
| Now look at the weekly chart. It shows an inverse head and shoulder pattern which might be forming. The operative word here is "might." As an active trader, I would urge you to wait until a breakout occurs, pusing the Nikkei over 11,000. A pattern can often change its shape even when it seems certain to break out, and it can look very different after only a few sessions. |
 Figure 2: Weekly chart of the Nikkei. Now assuming the head and shoulders pattern breaks to the upside, the target could be 14,800. This target is measured by taking the depth of the head from the neckline and adding it to the point of measurement to the upside. The weekly RSI has shifted its range from a bearish (30 to 60) to a bullish (80 to 50). Also the 50-week SMA has turned upwards towards the 200-week SMA, which is another positive sign. But confirmation will happen only over 11,000. A declining ADX below 30 still indicates consolidation. |
| It is time to watch the Nikkei because a big move is coming. |
He is founder of AGIP Securities Pvt. Ltd. which offers money management services, live chat rooms (during market hours) and independent technical analysis consultancy. The company has a big media presence from the likes of CNBC, NDTV Profit, and ZEE Business.
| Title: | Chief mkt strategist |
| Company: | AGIP Securities |
| India | |
| Phone # for sales: | 9871066337 |
| Website: | www.ashwanigujral.com |
| E-mail address: | contact@ashwanigujral.com |
Traders' Resource Links | |
| AGIP Securities has not added any product or service information to TRADERS' RESOURCE. | |
Click here for more information about our publications!
PRINT THIS ARTICLE

Request Information From Our Sponsors
- VectorVest, Inc.
- Executive Premier Workshop
- One-Day Options Course
- OptionsPro
- Retirement Income Workshop
- Sure-Fire Trading Systems (VectorVest, Inc.)
- Trading as a Business Workshop
- VectorVest 7 EOD
- VectorVest 7 RealTime/IntraDay
- VectorVest AutoTester
- VectorVest Educational Services
- VectorVest OnLine
- VectorVest Options Analyzer
- VectorVest ProGraphics v6.0
- VectorVest ProTrader 7
- VectorVest RealTime Derby Tool
- VectorVest Simulator
- VectorVest Variator
- VectorVest Watchdog
- StockCharts.com, Inc.
- Candle Patterns
- Candlestick Charting Explained
- Intermarket Technical Analysis
- John Murphy on Chart Analysis
- John Murphy's Chart Pattern Recognition
- John Murphy's Market Message
- MurphyExplainsMarketAnalysis-Intermarket Analysis
- MurphyExplainsMarketAnalysis-Visual Analysis
- StockCharts.com
- Technical Analysis of the Financial Markets
- The Visual Investor
