HOT TOPICS LIST
- MACD
- Fibonacci
- RSI
- Gann
- ADXR
- Stochastics
- Volume
- Triangles
- Futures
- Cycles
- Volatility
- ZIGZAG
- MESA
- Retracement
- Aroon
INDICATORS LIST
LIST OF TOPICS
PRINT THIS ARTICLE
by Kevin Hopson
The Canadian and U.S. Dollar Indexes have been moving in opposite directions for three years now and while this trend may continue in the near-term, there are signs of long-term trend reversals further down the road.
Position: Hold
Kevin Hopson
Kevin has been a technical analyst for roughly 10 years now. Previously, Kevin owned his own business and acted as a registered investment advisor, specializing in energy. He was also a freelance oil analyst for Orient Trading Co., a commodity futures trading firm in Japan. Kevin is currently a freelance writer.
PRINT THIS ARTICLE
TECHNICAL ANALYSIS
Mixed Signals For The Canadian And U.S. Dollar Indexes
01/07/04 04:14:32 PMby Kevin Hopson
The Canadian and U.S. Dollar Indexes have been moving in opposite directions for three years now and while this trend may continue in the near-term, there are signs of long-term trend reversals further down the road.
Position: Hold
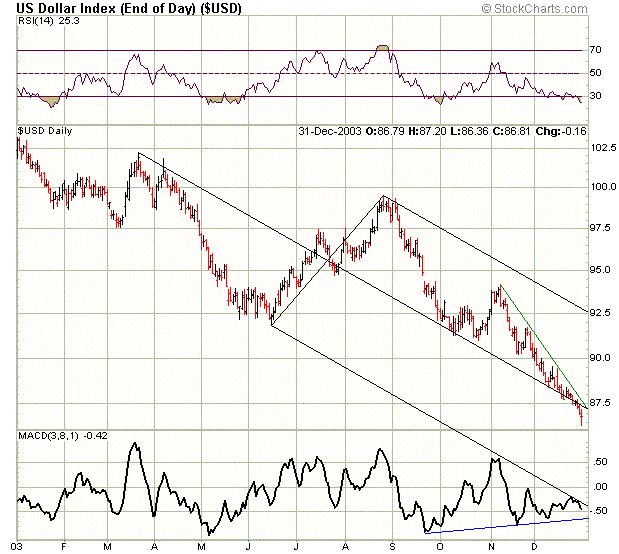
| I touched on the U.S. Dollar Index (USD) a few weeks ago, citing the possibility of a temporary correction in the near-term. More specifically, I said that bullish divergences on the daily chart and a potential falling wedge formation could spur a rally in prices. So far, this has yet to occur. For example, if you look at the one-year chart for the U.S. Dollar Index, you will notice that prices recently breached the median line of the black pitchfork. This could signal a downside breakout from the falling wedge formation, which is illustrated by the black median line and green downtrend line. |
| However, this has yet to be confirmed, as Wednesday's trading activity has left the near-term outlook uncertain. More specifically, though the index hit new lows this past Wednesday, prices reversed later in the day. In other words, the index recouped a good portion of its early day losses and closed in the middle of Wednesday's trading range. Mid-range closes can sometimes signal a bottom reversal after an extended downtrend. As a result, it will be important to watch post-holiday trading to see what develops. |

|
| Figure 1: One-year chart of U.S. Dollar Index. |
| Graphic provided by: Stockcharts.com. |
| |
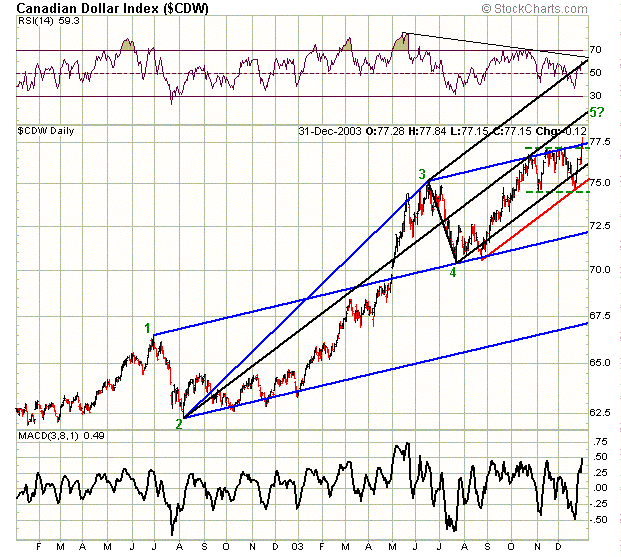
If you look at the two-year chart for the Canadian Dollar Index (CDW), you will notice the situation is just the opposite. The index has been in a long-term uptrend and recently broke out of a bullish trading range between $74.50 and $77.00. However, just like the U.S. Dollar Index, the Canadian Dollar Index saw an intraday reversal on Wednesday with the Canadian Dollar Index moving higher in the morning only to close at the low for the day. Additionally, the index found near-term resistance along the top blue parallel line. As a result, Wednesday's trading range breakout has yet to be confirmed. Figure 2: Canadian Dollar Index. |
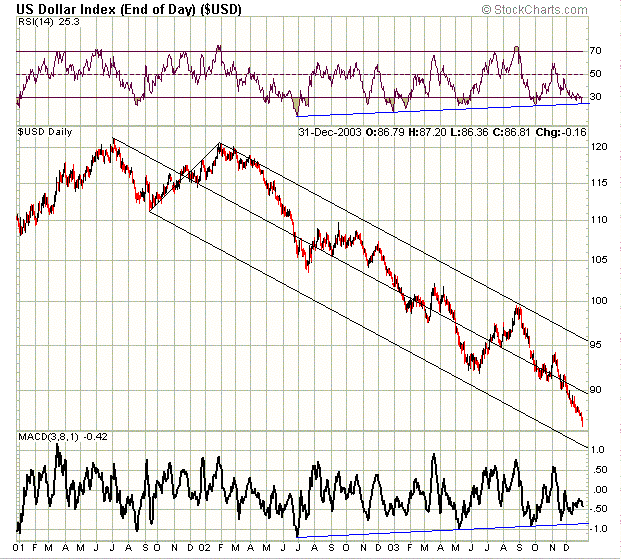
If the Canadian Dollar Index does move higher (confirming Wednesday's breakout in the process), prices could rally up to the $79.50 level in the near-term. This initial price target is calculated by taking the number of times that the index tested the upper channel line (2), multiplying it by the width of the trading range ($77.00-$74.50=$2.50) and adding this figure ($2.50 x 2=$5.00) to the lower channel line ($74.50 + $5.00 = $79.50). If you add this figure ($5.00) to the upper channel line ($77.00), you get a second price target of $82.00. So the Canadian Dollar Index could rally up to the $79.50 to $82.00 range in the near-term. Obviously, a rally in the Canadian Dollar Index would likely lead to further weakness in the U.S. Dollar Index. This would not be a big surprise given the potential breakouts (in opposite directions) we recently saw in the two indexes. Figure 3: Three-year chart for the U.S. Dollar Index. |
| However, whether you look at a short-term chart or a long-term chart of the U.S. Dollar Index, there continues to be bullish divergence patterns. For example, if you look at the three-year chart for the U.S. Dollar Index (Figure 3), you will notice that despite the long-term downtrend (as illustrated by the black pitchfork), both the relative strength index (RSI) and moving average convergence/divergence (MACD) have been putting in higher lows. Given the long-term nature of these bullish divergences, there is a good chance of a bottom reversal. When this occurs is anyone's guess but the signs are definitely there. Additionally, if you go back and look at the chart for the Canadian Dollar Index, you will see that the index appears to be in the fifth and final wave of its long-term uptrend. Normally, when prices break out of a trading range during a fifth wave, the calculated price target based on the channel breakout will usually act as the ultimate reversal point. Since the 2-3/4 median line (black pitchfork) sometimes acts as a completion point for wave 5 and this trendline is coming into play around the projected price target, there is the possibility for a long-term trend reversal at higher prices. In summary, the Canadian Dollar Index may continue higher in the near-term (while the U.S. Dollar Index drifts lower) but the long-term bullish divergences and estimated wave count signal a potential reversal further down the road. |
Kevin has been a technical analyst for roughly 10 years now. Previously, Kevin owned his own business and acted as a registered investment advisor, specializing in energy. He was also a freelance oil analyst for Orient Trading Co., a commodity futures trading firm in Japan. Kevin is currently a freelance writer.
| Glen Allen, VA | |
| E-mail address: | hopson_1@yahoo.com |
Click here for more information about our publications!
PRINT THIS ARTICLE

Request Information From Our Sponsors
- StockCharts.com, Inc.
- Candle Patterns
- Candlestick Charting Explained
- Intermarket Technical Analysis
- John Murphy on Chart Analysis
- John Murphy's Chart Pattern Recognition
- John Murphy's Market Message
- MurphyExplainsMarketAnalysis-Intermarket Analysis
- MurphyExplainsMarketAnalysis-Visual Analysis
- StockCharts.com
- Technical Analysis of the Financial Markets
- The Visual Investor
- VectorVest, Inc.
- Executive Premier Workshop
- One-Day Options Course
- OptionsPro
- Retirement Income Workshop
- Sure-Fire Trading Systems (VectorVest, Inc.)
- Trading as a Business Workshop
- VectorVest 7 EOD
- VectorVest 7 RealTime/IntraDay
- VectorVest AutoTester
- VectorVest Educational Services
- VectorVest OnLine
- VectorVest Options Analyzer
- VectorVest ProGraphics v6.0
- VectorVest ProTrader 7
- VectorVest RealTime Derby Tool
- VectorVest Simulator
- VectorVest Variator
- VectorVest Watchdog
