

HOT TOPICS LIST
- MACD
- Fibonacci
- RSI
- Gann
- ADXR
- Stochastics
- Volume
- Triangles
- Futures
- Cycles
- Volatility
- ZIGZAG
- MESA
- Retracement
- Aroon
INDICATORS LIST
LIST OF TOPICS
PRINT THIS ARTICLE
by Ashwani Gujral
Different indicators need to be used in trending and trading markets. Do not use trend following indicators in trading markets, or oscillators in trending markets.
Position: Buy
Ashwani Gujral
He is founder of AGIP Securities Pvt. Ltd. which offers money management services, live chat rooms (during market hours) and independent technical analysis consultancy. The company has a big media presence from the likes of CNBC, NDTV Profit, and ZEE Business.
PRINT THIS ARTICLE
MACD
ADRs, ADX and MACD
01/08/04 09:53:04 AMby Ashwani Gujral
Different indicators need to be used in trending and trading markets. Do not use trend following indicators in trading markets, or oscillators in trending markets.
Position: Buy
| ADRs Emerging markets, such as India's, are going through a huge bull run. India is emerging as a quality outsourcing destination for software and other services. It is taking a slice of the generics market opening up in the U.S. and its domestic economy is growing at 8.4%. One of the ways American traders and investors can participate in this country's growth is by trading ADRs of top Indian companies listed on NYSE and Nasdaq. Infosys Technologies Ltd. (INFY) is one such quality Indian software services provider. |
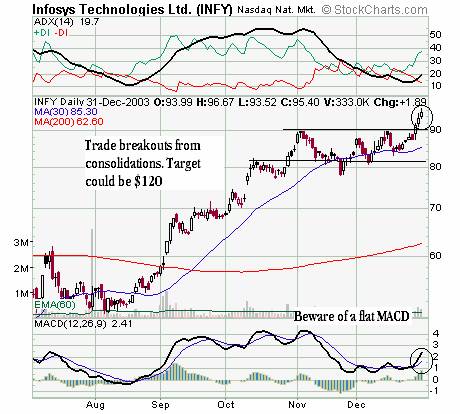
| The daily chart of Infosys shows the stock breaking out of a sideways consolidation. Such stocks potentially offer the highest returns and an excellent entry point into high flying stocks. When a stock consolidates, it is building new momentum for a continued upmove. This should provide a low risk entry point. A stock is less likely to correct sharply once it consolidates and moves up, although it is possible. Once a strong stock is identified either for buying or short selling, traders should wait for a consolidation and trade breakouts or breakdowns. The bottom or top of that consolidation can be used as stop-loss. Most of these consolidations occur in the middle of a move so it can be safely assumed that the move subsequent to breakout or breakdown is at least equal to the move before it. |
|
| Daily INFY chart |
| Graphic provided by: stockcharts.com. |
| |
| ADX Consolidating and trending markets are two different types of markets that require the use of different indicators. A consolidating market is a sideways-moving market with no specific bias either up or down that generally moves in a defined range. Oscillators such as stochastics and RSI with overbought and oversold levels are best for such markets. Trend following indicators like the MACD and moving averages should be used in trending markets. Using consolidating market indicators in a trending market or vice-versa can be lethal. Another indicator is the ADX, which can show the strength of a trend. An ADX of greater than 30 indicates a stronger trend, up or down, as does a rising ADX above 20. An ADX of less than 30 or one that is declining below 20 is, at best, a consolidation. Once the nature of the market is ascertained, the choice of indicators can be made. |
| MACD Finally, I am going to discuss MACD --when to use it and when it can be avoided. MACD is a classic trend following indicator. All of us probably buy when MACD's fast moving average crosses above the slow moving average, and sell when it goes below. But MACD can give a lot of whipsaws if not used in a trending market. Traders should avoid a flat MACD and wait for it take a decisive direction - either up or down. A flat MACD is generally visible on the chart as a consolidation. |
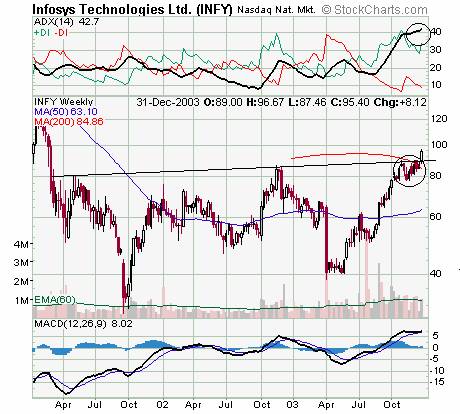 Weekly chart for INFY. The INFY weekly chart shows the stock price breaking out of a three year consolidation and in a very strong long-term trend. This is precisely the kind of stock I want to be long in. And I buy into all consolidations on the daily charts. When a stock breaks out, there are several indications on the daily and weekly charts, provided the right indicators are used. |
He is founder of AGIP Securities Pvt. Ltd. which offers money management services, live chat rooms (during market hours) and independent technical analysis consultancy. The company has a big media presence from the likes of CNBC, NDTV Profit, and ZEE Business.
| Title: | Chief mkt strategist |
| Company: | AGIP Securities |
| India | |
| Phone # for sales: | 9871066337 |
| Website: | www.ashwanigujral.com |
| E-mail address: | contact@ashwanigujral.com |
Traders' Resource Links | |
| AGIP Securities has not added any product or service information to TRADERS' RESOURCE. | |
Click here for more information about our publications!
Comments
Date:�01/14/04Rank:�5Comment:�
Date:�12/03/18Rank:�4Comment:�

Request Information From Our Sponsors
- StockCharts.com, Inc.
- Candle Patterns
- Candlestick Charting Explained
- Intermarket Technical Analysis
- John Murphy on Chart Analysis
- John Murphy's Chart Pattern Recognition
- John Murphy's Market Message
- MurphyExplainsMarketAnalysis-Intermarket Analysis
- MurphyExplainsMarketAnalysis-Visual Analysis
- StockCharts.com
- Technical Analysis of the Financial Markets
- The Visual Investor
- VectorVest, Inc.
- Executive Premier Workshop
- One-Day Options Course
- OptionsPro
- Retirement Income Workshop
- Sure-Fire Trading Systems (VectorVest, Inc.)
- Trading as a Business Workshop
- VectorVest 7 EOD
- VectorVest 7 RealTime/IntraDay
- VectorVest AutoTester
- VectorVest Educational Services
- VectorVest OnLine
- VectorVest Options Analyzer
- VectorVest ProGraphics v6.0
- VectorVest ProTrader 7
- VectorVest RealTime Derby Tool
- VectorVest Simulator
- VectorVest Variator
- VectorVest Watchdog