HOT TOPICS LIST
- MACD
- Fibonacci
- RSI
- Gann
- ADXR
- Stochastics
- Volume
- Triangles
- Futures
- Cycles
- Volatility
- ZIGZAG
- MESA
- Retracement
- Aroon
INDICATORS LIST
LIST OF TOPICS
PRINT THIS ARTICLE
by Koos van der Merwe
The price of pharmaceuticals and prescription drugs is far higher in the United States than in Canada, which has led many Canadian Pharmaceutical companies to tap the U.S. market via e-mail and offer cheaper prescription drugs. This is upsetting the drug industry, who look to the higher profits found in the U.S. market to cover research and development.
Position: Accumulate
Koos van der Merwe
Has been a technical analyst since 1969, and has worked as a futures and options trader with First Financial Futures in Johannesburg, South Africa.
PRINT THIS ARTICLE
ELLIOTT WAVE
Eon Labs, Another One To Watch
01/05/04 10:43:24 AMby Koos van der Merwe
The price of pharmaceuticals and prescription drugs is far higher in the United States than in Canada, which has led many Canadian Pharmaceutical companies to tap the U.S. market via e-mail and offer cheaper prescription drugs. This is upsetting the drug industry, who look to the higher profits found in the U.S. market to cover research and development.
Position: Accumulate
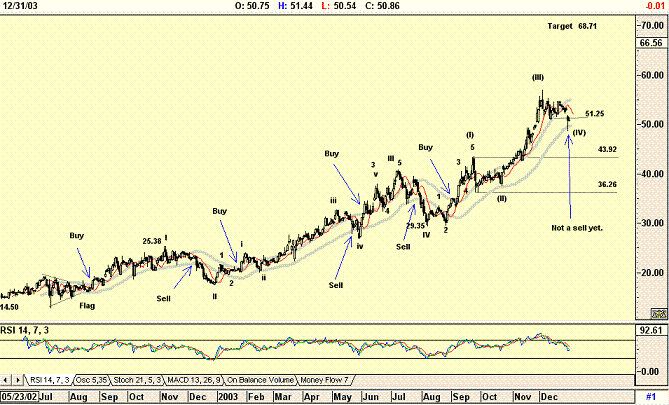
| Eon Labs, Inc. is a supplier of generic pharmaceuticals. They produce a broad range of pharmaceuticals in a wide variety of therapeutic categories. The chart below shows an interesting climb in the share price since their listing. |
| The chart shows the following: 1. My preferred Elliott Wave count that appears to have completed Wave (III) of Wave V and is now in a Wave (IV) of Wave V retracement that could take it to the fourth Wave of lesser degree, in the area between $36.26 and $43.92, before a rise to Wave V. 2. A Wave V projection suggests $68.71. This is a 3.618 Fibonacci projection of Wave I. I have not shown the Fibonacci levels on the chart as it makes it too busy, but it can be calculated as follows. Determine the distance of Wave I, multiply this by 3.618 and add the result to the low of Wave IV, (25.38 - 14.50 = 10.88 x 3.618 = 39.36 + 29.35 = 68.71). |

|
| EON Labs. |
| Graphic provided by: AdvancedGET. |
| |
| 3. The JM Internal band with previous buy and sell levels. The JM band is a 15-period moving average, and with Eon Labs is offset by 5% positive and -5% negative. A buy signal is given when the closing price breaks above the upper band, and a sell signal is given when the price breaks below the lower band. A rising stop-loss order or a break below a 5-period moving average offset forward by three periods. At the time of writing, the price was testing the lower band, but had not given a sell signal. |
| 4. The RSI indicator is negative suggesting weakness. To conclude, this stock is another one on my watch list. I will look for it to fall to the area of the fourth wave of lesser degree, but any move above $51.25, the low of December 10th, would trigger a buy signal. |
Has been a technical analyst since 1969, and has worked as a futures and options trader with First Financial Futures in Johannesburg, South Africa.
| Address: | 3256 West 24th Ave |
| Vancouver, BC | |
| Phone # for sales: | 6042634214 |
| E-mail address: | petroosp@gmail.com |
Click here for more information about our publications!
Comments
Date: 01/06/04Rank: 1Comment:

Request Information From Our Sponsors
- StockCharts.com, Inc.
- Candle Patterns
- Candlestick Charting Explained
- Intermarket Technical Analysis
- John Murphy on Chart Analysis
- John Murphy's Chart Pattern Recognition
- John Murphy's Market Message
- MurphyExplainsMarketAnalysis-Intermarket Analysis
- MurphyExplainsMarketAnalysis-Visual Analysis
- StockCharts.com
- Technical Analysis of the Financial Markets
- The Visual Investor
- VectorVest, Inc.
- Executive Premier Workshop
- One-Day Options Course
- OptionsPro
- Retirement Income Workshop
- Sure-Fire Trading Systems (VectorVest, Inc.)
- Trading as a Business Workshop
- VectorVest 7 EOD
- VectorVest 7 RealTime/IntraDay
- VectorVest AutoTester
- VectorVest Educational Services
- VectorVest OnLine
- VectorVest Options Analyzer
- VectorVest ProGraphics v6.0
- VectorVest ProTrader 7
- VectorVest RealTime Derby Tool
- VectorVest Simulator
- VectorVest Variator
- VectorVest Watchdog
