HOT TOPICS LIST
- MACD
- Fibonacci
- RSI
- Gann
- ADXR
- Stochastics
- Volume
- Triangles
- Futures
- Cycles
- Volatility
- ZIGZAG
- MESA
- Retracement
- Aroon
INDICATORS LIST
LIST OF TOPICS
PRINT THIS ARTICLE
by David Penn
As the head and shoulders top in $HUI disappears, higher prices for gold stocks emerge.
Position: N/A
David Penn
Technical Writer for Technical Analysis of STOCKS & COMMODITIES magazine, Working-Money.com, and Traders.com Advantage.
PRINT THIS ARTICLE
HEAD & SHOULDERS
Gold's End-of-Year Glitter
12/30/03 07:58:23 AMby David Penn
As the head and shoulders top in $HUI disappears, higher prices for gold stocks emerge.
Position: N/A
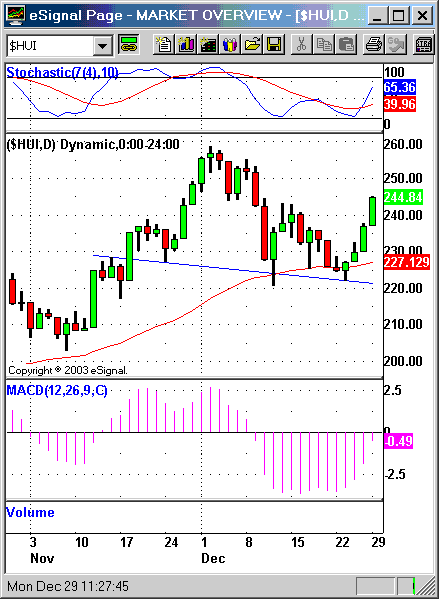
| I hadn't noticed the head and shoulders top in the AMEX Gold Bugs Index ($HUI) until a colleague who has been studying gold stocks for years pointed it out to me as the reason for his newfound (yet, mind you, short-term) caution with regard to gold stocks going forward. As the chart shows, the price action in $HUI from mid- to late November through to mid-December did in fact develop a head and shoulders top-like formation. This formation consists of a smallish left shoulder in mid-November, a head that developed from mid-November to early December, and a smallish right shoulder that developed around the middle of December. |
| If this head and shoulders top had succeeded in precipitating a correction in the advance in $HUI, then the size of the pattern suggested a downside of approximately 38 points, or a drop to around 182.58 on the $HUI. This would have meant a "taking out" of the $HUI's October low of 186.48. |

|
| How bullish is a failed head and shoulders top? So far, the answer is: quite bullish, at least for unhedged gold stocks. |
| Graphic provided by: eSignal. |
| |
| There were at least two factors, however, arguing against a significant breakdown in $HUI in December. The first, and most obvious, factor was the likely support provided by the 50-day exponential moving average (EMA). This moving average provided support during the first decline into December and appears to have provided crucial support during the $HUI's decline later in the month. The long lower shadows on a number of candlesticks as prices neared the 50-day EMA also underscores the support the moving average could provide. |
| The other factors involve the indicators: both the stochastic and the MACD histogram. The fact that the stochastic not only confirmed the higher low the $HUI established in late December, but also that the oscillator remained in relatively oversold territory should further be considered a bullish indication for $HUI. The indicator action in the MACD histogram is cause for further bullishness. Since the first decline into December, the MACD histogram moved beneath its "zero line" and by mid-month was already marking some significantly lower levels. In fact, the MACD histogram had not been lower in the $HUI in over a year! This, combined with the support of the 50-day EMA, suggested that gold stocks, rather than being ripe for a correction, might instead by ready to rush higher, perhaps testing and "taking out" the early December high at 258.60 (which is also the high of the bull market the $HUI has enjoyed since the fall of 2000.) |
Technical Writer for Technical Analysis of STOCKS & COMMODITIES magazine, Working-Money.com, and Traders.com Advantage.
| Title: | Technical Writer |
| Company: | Technical Analysis, Inc. |
| Address: | 4757 California Avenue SW |
| Seattle, WA 98116 | |
| Phone # for sales: | 206 938 0570 |
| Fax: | 206 938 1307 |
| Website: | www.Traders.com |
| E-mail address: | DPenn@traders.com |
Traders' Resource Links | |
| Charting the Stock Market: The Wyckoff Method -- Books | |
| Working-Money.com -- Online Trading Services | |
| Traders.com Advantage -- Online Trading Services | |
| Technical Analysis of Stocks & Commodities -- Publications and Newsletters | |
| Working Money, at Working-Money.com -- Publications and Newsletters | |
| Traders.com Advantage -- Publications and Newsletters | |
| Professional Traders Starter Kit -- Software | |
Click here for more information about our publications!
PRINT THIS ARTICLE

Request Information From Our Sponsors
- VectorVest, Inc.
- Executive Premier Workshop
- One-Day Options Course
- OptionsPro
- Retirement Income Workshop
- Sure-Fire Trading Systems (VectorVest, Inc.)
- Trading as a Business Workshop
- VectorVest 7 EOD
- VectorVest 7 RealTime/IntraDay
- VectorVest AutoTester
- VectorVest Educational Services
- VectorVest OnLine
- VectorVest Options Analyzer
- VectorVest ProGraphics v6.0
- VectorVest ProTrader 7
- VectorVest RealTime Derby Tool
- VectorVest Simulator
- VectorVest Variator
- VectorVest Watchdog
- StockCharts.com, Inc.
- Candle Patterns
- Candlestick Charting Explained
- Intermarket Technical Analysis
- John Murphy on Chart Analysis
- John Murphy's Chart Pattern Recognition
- John Murphy's Market Message
- MurphyExplainsMarketAnalysis-Intermarket Analysis
- MurphyExplainsMarketAnalysis-Visual Analysis
- StockCharts.com
- Technical Analysis of the Financial Markets
- The Visual Investor
