HOT TOPICS LIST
- MACD
- Fibonacci
- RSI
- Gann
- ADXR
- Stochastics
- Volume
- Triangles
- Futures
- Cycles
- Volatility
- ZIGZAG
- MESA
- Retracement
- Aroon
INDICATORS LIST
LIST OF TOPICS
PRINT THIS ARTICLE
by Gary Grosschadl
General Electric (GE) may be facing a downleg from here for several technical reasons.
Position: Sell
Gary Grosschadl
Independent Canadian equities trader and technical analyst based in Peterborough
Ontario, Canada.
PRINT THIS ARTICLE
CHART ANALYSIS
General Electric Showing Downside Potential
12/30/03 08:14:58 AMby Gary Grosschadl
General Electric (GE) may be facing a downleg from here for several technical reasons.
Position: Sell
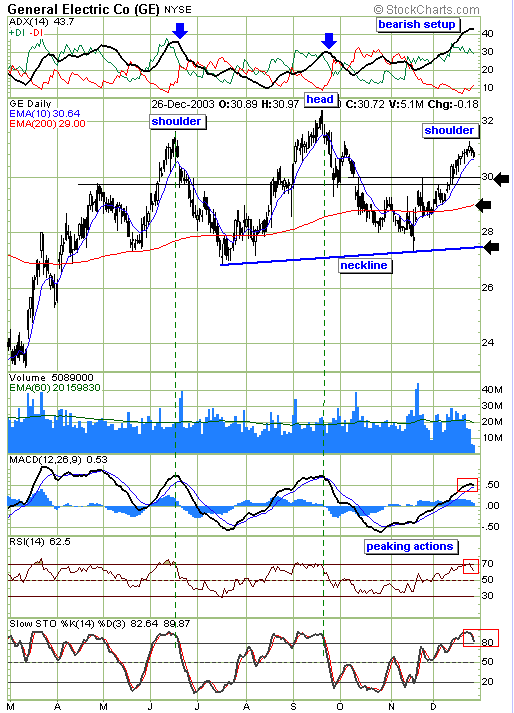
| General Electric stock has been climbing with the market the last several weeks but now the stock is looking tenuous. The daily chart below suggests a possible topping formation underway via a potential head and shoulders pattern. The stock appears to have peaked at its right shoulder and if so, then some downside is a strong likelihood. |
| The 10-day exponential moving average (EMA) has traced out the head and shoulders pattern rather well. Note that this line has acted as good support on the uplegs until the stock price peaked and then this same line acted as fairly tight resistance on the downlegs. A close under this moving average, currently at $30.64, could provide confirmation of a peak at GE's right shoulder. |

|
| GE's daily chart showing a possible topping formation and a probable downleg if confirmed. |
| Graphic provided by: Stockcharts.com. |
| |
| Should a downleg ensue here, three downside targets are suggested. The first target zone is in the $29.70 - $30 area, representing a previous gap from last October and also lining up with several significant previous candlestick highs and lows. If that level fails to hold then the next likely downside target is the 200-day EMA currently at $29. The 200-period moving average is often a significant line of support or resistance. Should that line fail then the neckline becomes the next target at roughly $27.50. Only if this neckline fails does the pattern actually confirm as a head and shoulders top but for now this line is treated as a possible test of the pattern. |
| Several indicators also hint at likely downside action. The DMI or directional movement indicator at the top of the chart shows a bearish set-up. The ADX line or trend strength component is considered overheated, being noticeably above the +DI line. Once this ADX line peaks and starts to decline a downleg is often already beginning as in previous occasions. The bottom three indicators are also reflecting their own peaks and have started to turn down. In the case of the MACD (moving average convergence/divergence) a bearish cross of its signal line acts as confirmation of downside action, and in a similar fashion the stochastics indicator should fall under its 80 level to show true bearish intent versus a whiplash or false signal. |
| Should the above bearish confirmations occur, starting with a close under the 10-day EMA, then the downside implications discussed here are pertinent. Should the stock head back up and close above the former peak of this "shoulder," the downside implications are negated. |
Independent Canadian equities trader and technical analyst based in Peterborough
Ontario, Canada.
| Website: | www.whatsonsale.ca/financial.html |
| E-mail address: | gwg7@sympatico.ca |
Click here for more information about our publications!
Comments
Date: 12/30/03Rank: 5Comment:
Date: 01/25/04Rank: 1Comment: incredibly vague

Request Information From Our Sponsors
- VectorVest, Inc.
- Executive Premier Workshop
- One-Day Options Course
- OptionsPro
- Retirement Income Workshop
- Sure-Fire Trading Systems (VectorVest, Inc.)
- Trading as a Business Workshop
- VectorVest 7 EOD
- VectorVest 7 RealTime/IntraDay
- VectorVest AutoTester
- VectorVest Educational Services
- VectorVest OnLine
- VectorVest Options Analyzer
- VectorVest ProGraphics v6.0
- VectorVest ProTrader 7
- VectorVest RealTime Derby Tool
- VectorVest Simulator
- VectorVest Variator
- VectorVest Watchdog
- StockCharts.com, Inc.
- Candle Patterns
- Candlestick Charting Explained
- Intermarket Technical Analysis
- John Murphy on Chart Analysis
- John Murphy's Chart Pattern Recognition
- John Murphy's Market Message
- MurphyExplainsMarketAnalysis-Intermarket Analysis
- MurphyExplainsMarketAnalysis-Visual Analysis
- StockCharts.com
- Technical Analysis of the Financial Markets
- The Visual Investor
