HOT TOPICS LIST
- MACD
- Fibonacci
- RSI
- Gann
- ADXR
- Stochastics
- Volume
- Triangles
- Futures
- Cycles
- Volatility
- ZIGZAG
- MESA
- Retracement
- Aroon
INDICATORS LIST
LIST OF TOPICS
PRINT THIS ARTICLE
by Kevin Hopson
Patterson-UTI Energy's recent trend reversal has led to a bullish pennant formation on the daily chart, indicating the potential for higher prices in the near-term.
Position: Hold
Kevin Hopson
Kevin has been a technical analyst for roughly 10 years now. Previously, Kevin owned his own business and acted as a registered investment advisor, specializing in energy. He was also a freelance oil analyst for Orient Trading Co., a commodity futures trading firm in Japan. Kevin is currently a freelance writer.
PRINT THIS ARTICLE
TRIANGLES
Patterson-UTI Energy's Bullish Pennant Formation
12/29/03 11:12:52 AMby Kevin Hopson
Patterson-UTI Energy's recent trend reversal has led to a bullish pennant formation on the daily chart, indicating the potential for higher prices in the near-term.
Position: Hold
| Patterson-UTI Energy Inc. (PTEN) is a provider of onshore contract drilling services to oil and gas companies in Texas, New Mexico, Oklahoma, Louisiana, Mississippi, Utah, and western Canada. Though the company's other operations are much smaller, Patterson also provides pressure pumping services in the Appalachian Basin and is engaged in the exploration and production of oil and gas in Texas and New Mexico. |
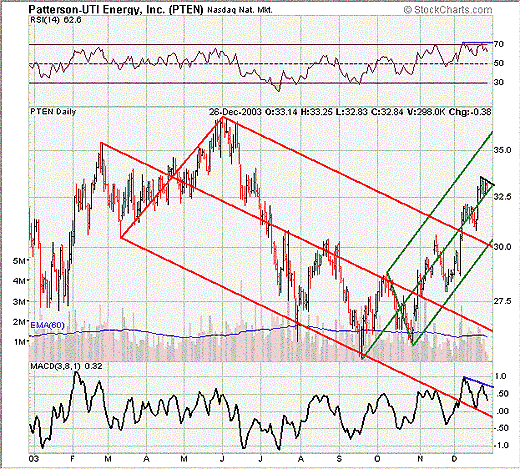
| Technically speaking, Patterson had been in a clear downtrend since June of this year. More specifically, notice how the stock was contained within the falling red pitchfork up until early December. When Patterson broke above the top red parallel line a few weeks ago, it signaled a trend change, as the six-month downtrend was no longer intact. In other words, even though the stock is still below June's high, the short-term trend is positive. |

|
| Graphic provided by: Stockcharts.com. |
| |
| This brings me to more recent developments. For example, notice that Patterson looks to be completing a bullish pennant formation. This is basically the formation of a symmetrical triangle - pattern of higher lows and lower highs - after a significant move up. This is illustrated by the green median (uptrend) line and the black downtrend line. Since pennant formations (and symmetrical triangles in general) tend to be continuation patterns, the expected break would be to the upside. |
| If investor sentiment is any indication, Patterson looks poised for further appreciation in the near-term. For example, despite the fact that the stock has moved higher the last two months, short interest has continued to climb. More specifically, short interest - as of December 8 - was 4.24M shares, a six percent increase from November levels. Based on the stock's average daily volume, it would take roughly four days for shorts to cover their positions. As a result, there is potential buying pressure to push the stock higher. |
| The only concerns on the daily chart are the bearish divergences in the relative strength index (RSI) and the moving average convergence/divergence (MACD). So, despite higher prices in recent weeks, the RSI has traded sideways, while the MACD has been putting in lower highs. Though these indicators can show divergences for long periods of time, meaning that prices could continue to move higher before reversing, I would wait for confirmation of a breakout before jumping into the stock. |
Kevin has been a technical analyst for roughly 10 years now. Previously, Kevin owned his own business and acted as a registered investment advisor, specializing in energy. He was also a freelance oil analyst for Orient Trading Co., a commodity futures trading firm in Japan. Kevin is currently a freelance writer.
| Glen Allen, VA | |
| E-mail address: | hopson_1@yahoo.com |
Click here for more information about our publications!
Comments

Request Information From Our Sponsors
- StockCharts.com, Inc.
- Candle Patterns
- Candlestick Charting Explained
- Intermarket Technical Analysis
- John Murphy on Chart Analysis
- John Murphy's Chart Pattern Recognition
- John Murphy's Market Message
- MurphyExplainsMarketAnalysis-Intermarket Analysis
- MurphyExplainsMarketAnalysis-Visual Analysis
- StockCharts.com
- Technical Analysis of the Financial Markets
- The Visual Investor
- VectorVest, Inc.
- Executive Premier Workshop
- One-Day Options Course
- OptionsPro
- Retirement Income Workshop
- Sure-Fire Trading Systems (VectorVest, Inc.)
- Trading as a Business Workshop
- VectorVest 7 EOD
- VectorVest 7 RealTime/IntraDay
- VectorVest AutoTester
- VectorVest Educational Services
- VectorVest OnLine
- VectorVest Options Analyzer
- VectorVest ProGraphics v6.0
- VectorVest ProTrader 7
- VectorVest RealTime Derby Tool
- VectorVest Simulator
- VectorVest Variator
- VectorVest Watchdog
