HOT TOPICS LIST
- MACD
- Fibonacci
- RSI
- Gann
- ADXR
- Stochastics
- Volume
- Triangles
- Futures
- Cycles
- Volatility
- ZIGZAG
- MESA
- Retracement
- Aroon
INDICATORS LIST
LIST OF TOPICS
PRINT THIS ARTICLE
by Koos van der Merwe
What with a mad cow, an orange alert for possible terrorist attacks, and a winter that in some parts of the country has been far more trying than previous years, what else can go wrong with the market? The chart of the Dow gives an idea of what to expect in the New Year.
Position: Sell
Koos van der Merwe
Has been a technical analyst since 1969, and has worked as a futures and options trader with First Financial Futures in Johannesburg, South Africa.
PRINT THIS ARTICLE
ELLIOTT WAVE
How Now Fine Dow?
12/29/03 09:59:20 AMby Koos van der Merwe
What with a mad cow, an orange alert for possible terrorist attacks, and a winter that in some parts of the country has been far more trying than previous years, what else can go wrong with the market? The chart of the Dow gives an idea of what to expect in the New Year.
Position: Sell
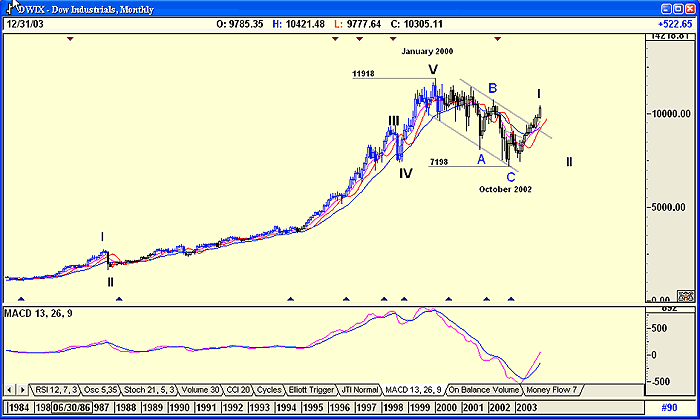
 Figure 1: Monthly chart of the Dow. The chart above shows the Dow from August 1984 to the present. I have drawn in my version of the Elliott wave count up to January 2000, and the bear market retracement since then. The chart suggests that the bear market ended in October 2002, as confirmed by the MACD indicator shown in the lower section. |
| Since then the Dow has moved upwards in what could be a Wave I. Now all Wave I's up must come to an end, usually in a Wave II down. Wave II's can fall to 100% of the rise of Wave I, and may even occasionally exceed it. However, years of experience have taught me that I should forecast a Wave II as a 72% retracement of Wave I, just to be on the safe side. Knowing and expecting this, now look at a daily chart and assess the Dow's short-term movement. |

|
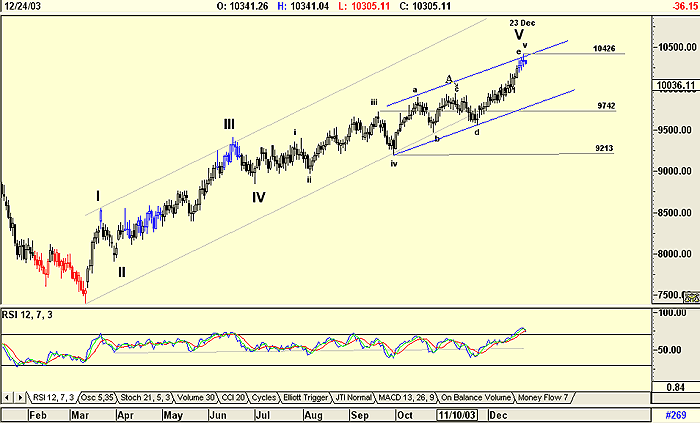
| Figure 2: Daily chart of the Dow. |
| Graphic provided by: AdvancedGET. |
| |
| The daily chart shows my suggested wave count. In it, the fifth wave culminated in an "abcde" rising formation. Usually this type of count suggests a rising wedge for the fifth wave, but in this case, it was more a rising flag formation. The suggestion of a retracement is very real, though, as confirmed by the RSI indicator. Past history of the indicator suggests a pause or sideways movement before the fall, and with this week being between Christmas and New Years, a time of low volatility, this could happen. A bear retracement after a fifth wave rise is usually an ABC retracement, with a fall to the fourth wave of lesser degree. In the chart this retracement could be anywhere between 9213 and 9472. |
| So, it looks as if the New Year will start with a whimper, and not a bang as forecast by most economists. Of course, as an Elliottician, I have an alternate count in my back pocket, and won't hesitate to pull it out if events should change. |
Has been a technical analyst since 1969, and has worked as a futures and options trader with First Financial Futures in Johannesburg, South Africa.
| Address: | 3256 West 24th Ave |
| Vancouver, BC | |
| Phone # for sales: | 6042634214 |
| E-mail address: | petroosp@gmail.com |
Click here for more information about our publications!
Comments
Date: 01/02/04Rank: 4Comment:
Date: 01/20/04Rank: 3Comment:

Request Information From Our Sponsors
- StockCharts.com, Inc.
- Candle Patterns
- Candlestick Charting Explained
- Intermarket Technical Analysis
- John Murphy on Chart Analysis
- John Murphy's Chart Pattern Recognition
- John Murphy's Market Message
- MurphyExplainsMarketAnalysis-Intermarket Analysis
- MurphyExplainsMarketAnalysis-Visual Analysis
- StockCharts.com
- Technical Analysis of the Financial Markets
- The Visual Investor
- VectorVest, Inc.
- Executive Premier Workshop
- One-Day Options Course
- OptionsPro
- Retirement Income Workshop
- Sure-Fire Trading Systems (VectorVest, Inc.)
- Trading as a Business Workshop
- VectorVest 7 EOD
- VectorVest 7 RealTime/IntraDay
- VectorVest AutoTester
- VectorVest Educational Services
- VectorVest OnLine
- VectorVest Options Analyzer
- VectorVest ProGraphics v6.0
- VectorVest ProTrader 7
- VectorVest RealTime Derby Tool
- VectorVest Simulator
- VectorVest Variator
- VectorVest Watchdog
