

HOT TOPICS LIST
- MACD
- Fibonacci
- RSI
- Gann
- ADXR
- Stochastics
- Volume
- Triangles
- Futures
- Cycles
- Volatility
- ZIGZAG
- MESA
- Retracement
- Aroon
INDICATORS LIST
LIST OF TOPICS
PRINT THIS ARTICLE
by Ashwani Gujral
ADX is one of the indicators used to determine whether a stock is in a trend or not. This UPS example shows how to use the ADX along with chart patterns to enter high probability trades.
Position: Buy
Ashwani Gujral
He is founder of AGIP Securities Pvt. Ltd. which offers money management services, live chat rooms (during market hours) and independent technical analysis consultancy. The company has a big media presence from the likes of CNBC, NDTV Profit, and ZEE Business.
PRINT THIS ARTICLE
UPS and the ADX
12/31/03 10:00:17 AMby Ashwani Gujral
ADX is one of the indicators used to determine whether a stock is in a trend or not. This UPS example shows how to use the ADX along with chart patterns to enter high probability trades.
Position: Buy
| People new to technical analysis seem to believe that unless they know the intricacies of all the indicators and patterns, they are going to be unsuccessful. But most seasoned traders and analysts rely on only a few patterns they are comfortable with, and continue to fine tune their use of these patterns. You just need to understand a few techniques in order to invest profitably. Out of the available universe of stocks and sectors it is possible to short list the ones with the clearest patterns and then choose your trades. Money is most easily made in a stock that is trending. Once it is established that a stock is trending, there are methods of taking low risk entries into such stocks. |
| Let's consider the UPS stock shown on the daily chart below. This stock is clearly in an uptrend. This is evident from the ADX, which is above 30. An ADX above 30, or above 20 and rising, signifies a strong trend, up or down. I would not consider a stock to be trending if its ADX was under 30 and declining towards 20, or if it was below 20. It would, at best, be a consolidation. Whenever the ADX is higher than 30, all pullbacks can be used to enter the trend. Currently UPS has formed an ascending triangle consolidation and has broken out at $73.75. A short-term trader would wait for this type of consolidation and enter at the breakout, setting a stop-loss at $72.5, the preceding pivot point. |
|
| Figure 1: UPS daily chart. |
| Graphic provided by: Stockcharts.com. |
| |
| A low risk entry is provided by a 7%K, 10%D slow stochastic. These values are different from the default values given in technical analysis software, but I have found them to be very effective. On the chart, %K is the fast (black) line and %D (slow) the slow line. If the stock is an uptrend strong enough push the ADX above 30, all sell signals should be avoided. Each time the %K loops upwards and goes through %D, a buy signal is given. |
| The above methodology is confirmed by the patterns on the daily and the weekly charts. The daily chart shows an ascending triangle, which is a consolidation or continuation pattern. I believe the target point for a reversal pattern is different from that of a consolidation pattern. If the same ascending triangle is considered a reversal pattern, I would calculate the target by using the height of the first reaction to the main move. But in the case of all consolidation patterns, a consolidation generally occurs in the middle of a move and it is safe to assume that a move similar to the one preceding the consolidation can be expected on breakout. The target for UPS on both a weekly and daily basis is $82.5. This is where strong resistance may be found. |
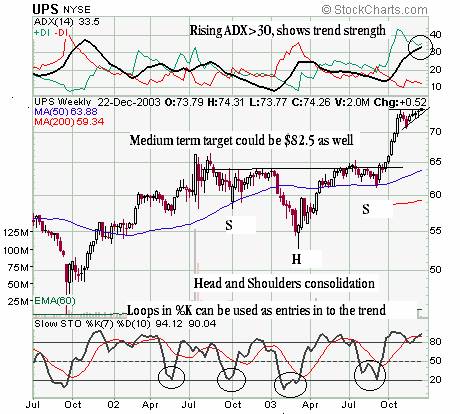 Figure 2: Weekly chart for UPS. Again in the weekly chart, there is another head and shoulders consolidation. The neckline should provide strong support at $65. So, medium-term traders can use $65 as the stop. Again loops in the stochastics offer entry points on a medium-term basis. The ascending triangle on the daily chart appears as a continuation pause after a head and shoulder breakout, thus reinforcing our analysis of the daily chart. |
He is founder of AGIP Securities Pvt. Ltd. which offers money management services, live chat rooms (during market hours) and independent technical analysis consultancy. The company has a big media presence from the likes of CNBC, NDTV Profit, and ZEE Business.
| Title: | Chief mkt strategist |
| Company: | AGIP Securities |
| India | |
| Phone # for sales: | 9871066337 |
| Website: | www.ashwanigujral.com |
| E-mail address: | contact@ashwanigujral.com |
Traders' Resource Links | |
| AGIP Securities has not added any product or service information to TRADERS' RESOURCE. | |
Click here for more information about our publications!
Comments
Date:�12/31/03Rank:�5Comment:�
Date:�01/06/04Rank:�5Comment:�lots of good ideas here. thanks.

Request Information From Our Sponsors
- StockCharts.com, Inc.
- Candle Patterns
- Candlestick Charting Explained
- Intermarket Technical Analysis
- John Murphy on Chart Analysis
- John Murphy's Chart Pattern Recognition
- John Murphy's Market Message
- MurphyExplainsMarketAnalysis-Intermarket Analysis
- MurphyExplainsMarketAnalysis-Visual Analysis
- StockCharts.com
- Technical Analysis of the Financial Markets
- The Visual Investor
- VectorVest, Inc.
- Executive Premier Workshop
- One-Day Options Course
- OptionsPro
- Retirement Income Workshop
- Sure-Fire Trading Systems (VectorVest, Inc.)
- Trading as a Business Workshop
- VectorVest 7 EOD
- VectorVest 7 RealTime/IntraDay
- VectorVest AutoTester
- VectorVest Educational Services
- VectorVest OnLine
- VectorVest Options Analyzer
- VectorVest ProGraphics v6.0
- VectorVest ProTrader 7
- VectorVest RealTime Derby Tool
- VectorVest Simulator
- VectorVest Variator
- VectorVest Watchdog