

HOT TOPICS LIST
- MACD
- Fibonacci
- RSI
- Gann
- ADXR
- Stochastics
- Volume
- Triangles
- Futures
- Cycles
- Volatility
- ZIGZAG
- MESA
- Retracement
- Aroon
INDICATORS LIST
LIST OF TOPICS
PRINT THIS ARTICLE
by Ashwani Gujral
Here is a good example of an inverse head & shoulders formation on the chart for Janus Capital Group (JNS).
Position: N/A
Ashwani Gujral
He is founder of AGIP Securities Pvt. Ltd. which offers money management services, live chat rooms (during market hours) and independent technical analysis consultancy. The company has a big media presence from the likes of CNBC, NDTV Profit, and ZEE Business.
PRINT THIS ARTICLE
HEAD & SHOULDERS
Janus Breaks Out Of Short-Term Reversal Pattern
12/29/03 11:00:32 AMby Ashwani Gujral
Here is a good example of an inverse head & shoulders formation on the chart for Janus Capital Group (JNS).
Position: N/A
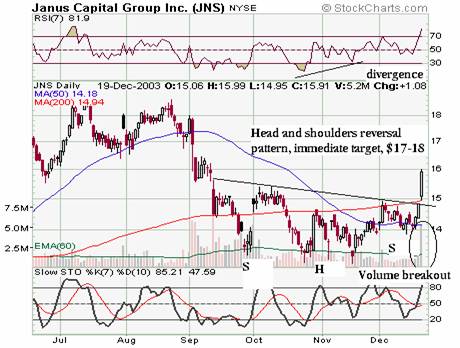
| Technical analysis is all about probabilities. Some price patterns have a higher probability of success than others, and the head and shoulders pattern is one of the highest probability patterns and one of the surest in predicting trend reversals in technical analysis. In my experience head and shoulders breakouts are successful about 95% of the time. |
| Janus is an example of an inverse head and shoulders breakout, or bottoming pattern. This pattern consists of three moves: a down move called the left shoulder, an up move followed by a second down move as the market tries to sell off again called the head, and finally a third, smaller up move and sell-off happens to form the right shoulder. The market recovers after each low and when these lows are connected they form a line called the neckline support. The key to an inverse head and shoulders breakout is that it occur on very high volume. A rising market needs participation and that translates into volume. By contrast, a normal head and shoulder pattern has all the same characteristics and is a topping out pattern. In this article, I will look at an inverse head and shoulders breakout that occurred on December 19, 2003, on Janus' daily chart. Janus had declined from $18 to $13 where it then formed an inverse head and shoulders bottoming pattern. It broke out to the upside as it crossed $15. This breakout occurred on very high volume and thus added to the veracity of a successful breakout. The Janus inverse head and shoulder pattern actually has two heads and two shoulders, which is a rarity. In this case, it gives a hint of a bottom that may be coming. An advance warning of a possible bottom in the Janus daily chart was given by the 7-day RSI which showed positive divergence as the second head formed. But divergences should not be traded unless confirmed by price. After the breakout the price moved over key moving averages, such as the 200-day MA and the 50-week MA, both of which take some effort to cross and signal that the stock is entering bull territory. |
|
| Figure 1: Daily chart for JNS. |
| Graphic provided by: StockCharts.com. |
| |
| The target of both types of the head and shoulder pattern can be calculated by measuring the height of the head from the neckline. This would be the minimum size of the move occurring on the other side of a breakout. The stop-loss should be kept at the bottom of the right shoulder. In the 5% of the cases where the pattern fails, large moves often occur in the opposite direction as market participants are trapped in the original direction. A low risk entry into the Janus chart can be taken for the short-term when the stock retraces to the neckline or at the 200-day MA, which is about $15. Medium-term traders can even buy the stock at current levels with a stop-loss of $14. The short-term target should be in the $17-$18 range. A medium-term target would be closer to $21. |
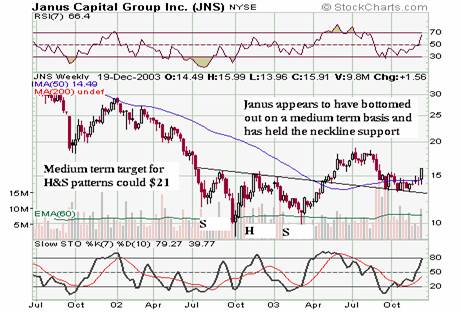 Figure 2: Weekly chart for JNS. Also a confirmation can be found in the weekly time frame. This shows what an upward breakout would look like from a larger perspective. As you can see on the weekly chart, a breakout has already occurred on a larger head and shoulders formation, after which the price retraced and retested the neckline. The price then consolidated and broke to the upside. This consolidation occured in the form of a head and shoulders pattern on the daily chart. So both the charts support this positive movement. Technical analysis works best when there is a confluence of factors as has happened with Janus. |
He is founder of AGIP Securities Pvt. Ltd. which offers money management services, live chat rooms (during market hours) and independent technical analysis consultancy. The company has a big media presence from the likes of CNBC, NDTV Profit, and ZEE Business.
| Title: | Chief mkt strategist |
| Company: | AGIP Securities |
| India | |
| Phone # for sales: | 9871066337 |
| Website: | www.ashwanigujral.com |
| E-mail address: | contact@ashwanigujral.com |
Traders' Resource Links | |
| AGIP Securities has not added any product or service information to TRADERS' RESOURCE. | |
Click here for more information about our publications!
Comments
Date:�12/30/03Rank:�5Comment:�
Date:�12/31/03Rank:�3Comment:�

Request Information From Our Sponsors
- VectorVest, Inc.
- Executive Premier Workshop
- One-Day Options Course
- OptionsPro
- Retirement Income Workshop
- Sure-Fire Trading Systems (VectorVest, Inc.)
- Trading as a Business Workshop
- VectorVest 7 EOD
- VectorVest 7 RealTime/IntraDay
- VectorVest AutoTester
- VectorVest Educational Services
- VectorVest OnLine
- VectorVest Options Analyzer
- VectorVest ProGraphics v6.0
- VectorVest ProTrader 7
- VectorVest RealTime Derby Tool
- VectorVest Simulator
- VectorVest Variator
- VectorVest Watchdog
- StockCharts.com, Inc.
- Candle Patterns
- Candlestick Charting Explained
- Intermarket Technical Analysis
- John Murphy on Chart Analysis
- John Murphy's Chart Pattern Recognition
- John Murphy's Market Message
- MurphyExplainsMarketAnalysis-Intermarket Analysis
- MurphyExplainsMarketAnalysis-Visual Analysis
- StockCharts.com
- Technical Analysis of the Financial Markets
- The Visual Investor