

HOT TOPICS LIST
- MACD
- Fibonacci
- RSI
- Gann
- ADXR
- Stochastics
- Volume
- Triangles
- Futures
- Cycles
- Volatility
- ZIGZAG
- MESA
- Retracement
- Aroon
INDICATORS LIST
LIST OF TOPICS
PRINT THIS ARTICLE
by Ashwani Gujral
Leaders of a previous bull market often get slaughtered in the subsequent bear market, and that is exactly what happened to technology stocks and to Cisco Systems.
Position: N/A
Ashwani Gujral
He is founder of AGIP Securities Pvt. Ltd. which offers money management services, live chat rooms (during market hours) and independent technical analysis consultancy. The company has a big media presence from the likes of CNBC, NDTV Profit, and ZEE Business.
PRINT THIS ARTICLE
ROUND TOP & BOTTOM
Cisco Systems Bottoms Out Into A Basing Pattern
12/23/03 12:14:17 PMby Ashwani Gujral
Leaders of a previous bull market often get slaughtered in the subsequent bear market, and that is exactly what happened to technology stocks and to Cisco Systems.
Position: N/A
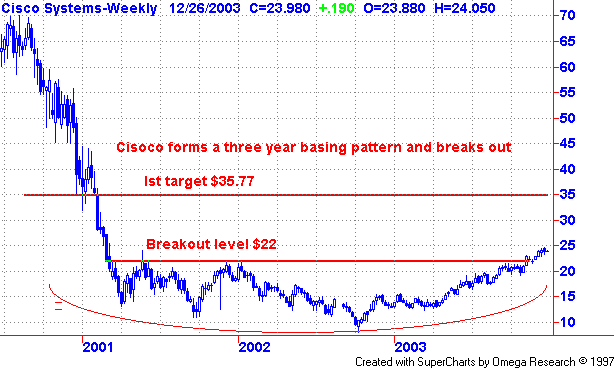
| In 2002 Cisco Systems (CSCO) fell from a high of $82 to a low of $7.77. Cisco is considered a bellwether technology stock and a leader in the Nasdaq index so it has significant impact on the technology sector. Cisco, after getting slaughtered in the previous bear market, has consolidated and has been trading in a huge basing pattern between $7.77 and $22 for the last three years. |
| Such huge patterns are often made after vertical falls in stock prices. Most technology leaders have bottomed out in the last few years after making flattish patterns, as in Cisco's case, and are now getting back into the rallying mode. Fundamentally, during rough bear markets the inefficient competition goes out of business, and leaders often restructure their businesses and thus have improved outlooks after two to three years of consolidation. Cisco, therefore, could be considered a good portfolio stock at its current level. |
|
| Figure 1: Weekly chart for Cisco Systems |
| Graphic provided by: SuperCharts. |
| |
| The other evidence of a shift from bearish to bullish is the RSI. As you can see, during the entire bear market, Cisco's RSI stayed between 30 and 60. As Cisco started shifting from a bear to bull market, the RSI shifted zones to the 60 to 80 area. These changes in the RSI are an important indicator of a shift from a bear to bull market. However I believe using the RSI as an oversold/overbought indicator is obsolete. Rather, the RSI is an excellent tool to indicate when to buy into pullbacks during a trend. To do this, first establish a trend by using one of the trend following indicators such as the MACD (moving average convergence/divergence), or moving averages in a high or the same time frame. Use a 7-period RSI to identify oversold levels in the stock and buy whenever the RSI hits 30. Remember, each consecutive low in the stock should be higher than the previous one. |
Cisco should see an initial target $35.77 and after that continue on to higher levels. At this point, Cisco seems to have more upside than downside potential. 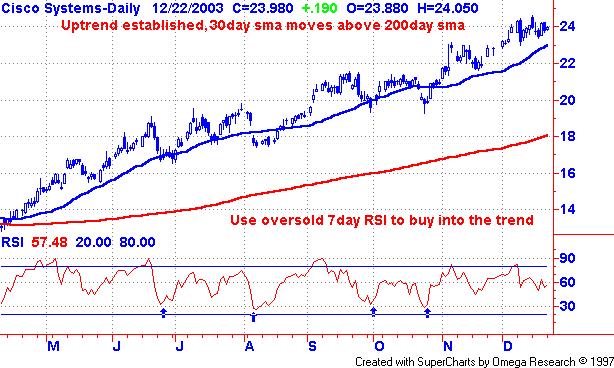 Figure 2: Daily chart of Cisco Systems. |
| A lot of other technology stocks will have similar patterns. Looking for huge basing patterns and zone shifts in RSI is a good way to find out which companies are recovering and which are not. Buy into these bottoming stocks when they trade at fresh two to three year highs and break important resistance pivots. The leading stocks on the Nasdaq will also give indications of the technical position of the index. The Nasdaq Composite seems poisesd to cross its previous highs. If that happens, Cisco will play a large part in it. |
He is founder of AGIP Securities Pvt. Ltd. which offers money management services, live chat rooms (during market hours) and independent technical analysis consultancy. The company has a big media presence from the likes of CNBC, NDTV Profit, and ZEE Business.
| Title: | Chief mkt strategist |
| Company: | AGIP Securities |
| India | |
| Phone # for sales: | 9871066337 |
| Website: | www.ashwanigujral.com |
| E-mail address: | contact@ashwanigujral.com |
Traders' Resource Links | |
| AGIP Securities has not added any product or service information to TRADERS' RESOURCE. | |
Click here for more information about our publications!
Comments
Date:�12/26/03Rank:�5Comment:�
Date:�12/30/03Rank:�5Comment:�

Request Information From Our Sponsors
- VectorVest, Inc.
- Executive Premier Workshop
- One-Day Options Course
- OptionsPro
- Retirement Income Workshop
- Sure-Fire Trading Systems (VectorVest, Inc.)
- Trading as a Business Workshop
- VectorVest 7 EOD
- VectorVest 7 RealTime/IntraDay
- VectorVest AutoTester
- VectorVest Educational Services
- VectorVest OnLine
- VectorVest Options Analyzer
- VectorVest ProGraphics v6.0
- VectorVest ProTrader 7
- VectorVest RealTime Derby Tool
- VectorVest Simulator
- VectorVest Variator
- VectorVest Watchdog
- StockCharts.com, Inc.
- Candle Patterns
- Candlestick Charting Explained
- Intermarket Technical Analysis
- John Murphy on Chart Analysis
- John Murphy's Chart Pattern Recognition
- John Murphy's Market Message
- MurphyExplainsMarketAnalysis-Intermarket Analysis
- MurphyExplainsMarketAnalysis-Visual Analysis
- StockCharts.com
- Technical Analysis of the Financial Markets
- The Visual Investor