

HOT TOPICS LIST
- MACD
- Fibonacci
- RSI
- Gann
- ADXR
- Stochastics
- Volume
- Triangles
- Futures
- Cycles
- Volatility
- ZIGZAG
- MESA
- Retracement
- Aroon
INDICATORS LIST
LIST OF TOPICS
PRINT THIS ARTICLE
by Koos van der Merwe
The period before Christmas, especially when Christmas falls on a week day, means days of low volume and much volatility as traders take profits before the long weekend, and mutual funds adjust their portfolios to "pretty-pretty" the picture of their holdings before year's end. This provides an opportunity for the wide awake, medium- to long-term investor to find bargains.
Position: Accumulate
Koos van der Merwe
Has been a technical analyst since 1969, and has worked as a futures and options trader with First Financial Futures in Johannesburg, South Africa.
PRINT THIS ARTICLE
FLAGS AND PENNANTS
Nortel - Something To Look At?
12/23/03 10:08:00 AMby Koos van der Merwe
The period before Christmas, especially when Christmas falls on a week day, means days of low volume and much volatility as traders take profits before the long weekend, and mutual funds adjust their portfolios to "pretty-pretty" the picture of their holdings before year's end. This provides an opportunity for the wide awake, medium- to long-term investor to find bargains.
Position: Accumulate
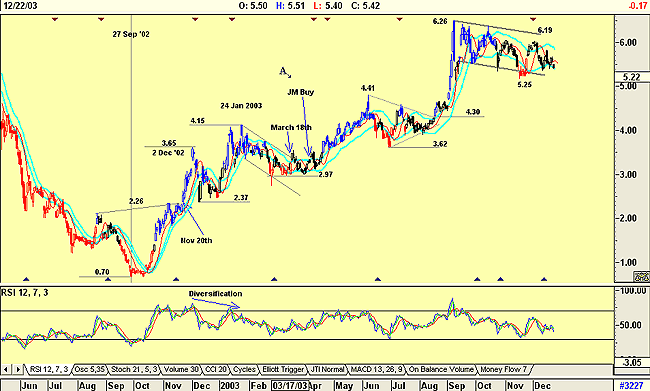
| One such bargain could be an old favorite, Nortel. Let's see what the charts say. On September 27, 2002, Nortel reached the climax of an inverted head and shoulder formation. When Nortel broke the neckline on November 20th, its target was $3.82 (2.26 - 0.70 = 1.56 + 2.26 = 3.82). On December 2, 2002, the price reached $3.65 before falling back to $2.37. Most investors would have been taken out by a rising stop and been happy with a comfortable profit. All the indicators had fallen into line with a sell signal. |
| Then, however, the price reversed and rose to $4.15 by January 24, 2003. Investors would have remained out of the share because of the diversification sell signal given by the RSI indicator. Speculators may have taken the risk as the price broke above $3.65, the high of December 2nd, to scalp a few cents. From January 24th, the price then fell into what turned out to be a flag formation. Investors waited for a buy signal as the price broke out of the flag on March 18th, and if they bought, would have immediately regretted their decision as the price fell back to form a triple bottom at $2.97. |
|
| Graphic provided by: AdvancedGET. |
| |
| Triple bottoms are formidable support levels, and with the RSI indicator trending up, an astute investor prepared to take the risk may have bought at this price, or perhaps preferred to wait until a JM buy signal had been given (a JM buy signal is given when the price breaks above the upper band of the JM band, a 15 period simple moving average offset by 2% up and down). They would have calculated a target of $4.57 (4.15 - 2.37 = 1.78 + 2.97 = 4.57). Once again they would have been taken out by a rising stop as the price fell back after reaching a high of $4.41. |
| Traders would have then watched the share as it formed a triangle and happy with the success of their previous venture on patterns, would have bought as the price broke out of the triangle at $4.30. The target would be $5.74 (4.41 - 2.97 = 1.44 + 4.30 = 5.74). Once again they would have been taken out on a rising stop as the price fell rather dramatically after reaching $6.26. |
| What now? Well, looking at the chart, the price appears to be once again forming a flag pattern. Should a breakout occur at $6.19, the target would be $7.89 (6.26 - 3.62 = 2.64 + 5.25 = 7.89), and would give a profit of $1.70. With a stop-loss on entry of 10% at $5.58 our loss will be $0.61. Using my risk/reward ratio of 2.5 :1, this gives a profit target of $1.52. The reward on the buy therefore would be worth the risk. |
Has been a technical analyst since 1969, and has worked as a futures and options trader with First Financial Futures in Johannesburg, South Africa.
| Address: | 3256 West 24th Ave |
| Vancouver, BC | |
| Phone # for sales: | 6042634214 |
| E-mail address: | petroosp@gmail.com |
Click here for more information about our publications!
Comments
Date:�12/25/03Rank:�4Comment:�
Date:�12/26/03Rank:�5Comment:�

Request Information From Our Sponsors
- StockCharts.com, Inc.
- Candle Patterns
- Candlestick Charting Explained
- Intermarket Technical Analysis
- John Murphy on Chart Analysis
- John Murphy's Chart Pattern Recognition
- John Murphy's Market Message
- MurphyExplainsMarketAnalysis-Intermarket Analysis
- MurphyExplainsMarketAnalysis-Visual Analysis
- StockCharts.com
- Technical Analysis of the Financial Markets
- The Visual Investor
- VectorVest, Inc.
- Executive Premier Workshop
- One-Day Options Course
- OptionsPro
- Retirement Income Workshop
- Sure-Fire Trading Systems (VectorVest, Inc.)
- Trading as a Business Workshop
- VectorVest 7 EOD
- VectorVest 7 RealTime/IntraDay
- VectorVest AutoTester
- VectorVest Educational Services
- VectorVest OnLine
- VectorVest Options Analyzer
- VectorVest ProGraphics v6.0
- VectorVest ProTrader 7
- VectorVest RealTime Derby Tool
- VectorVest Simulator
- VectorVest Variator
- VectorVest Watchdog