

HOT TOPICS LIST
- MACD
- Fibonacci
- RSI
- Gann
- ADXR
- Stochastics
- Volume
- Triangles
- Futures
- Cycles
- Volatility
- ZIGZAG
- MESA
- Retracement
- Aroon
INDICATORS LIST
LIST OF TOPICS
PRINT THIS ARTICLE
by Kevin Hopson
Oil service stocks have broken out of a five-month trading range but is the rally for real?
Position: Hold
Kevin Hopson
Kevin has been a technical analyst for roughly 10 years now. Previously, Kevin owned his own business and acted as a registered investment advisor, specializing in energy. He was also a freelance oil analyst for Orient Trading Co., a commodity futures trading firm in Japan. Kevin is currently a freelance writer.
PRINT THIS ARTICLE
CHANNEL LINES
Are Oil Service Stocks Headed Higher?
12/19/03 01:42:42 PMby Kevin Hopson
Oil service stocks have broken out of a five-month trading range but is the rally for real?
Position: Hold
| Up until recently, the outlook for oil service stocks had been pretty bleak, as a potential bearish trading range was showing signs of further weakness in the short-term. However, things are not always as they appear. For example, if you look at a one-year chart for the Merrill Lynch Oil Service Holders (OIH), an exchange traded fund (ETF) that mirrors the Oil Services Index (OSX), it appears that these stocks have broken to the upside from a five-month trading range. |
| Prices normally break to the downside from a trading range when the consolidation period follows a steep decline. As you can see in the chart, oil service stocks sold off in June and July before settling into a trading range for the last several months. Since trading ranges tend to be continuation patterns, the recent consolidation appeared to be bearish. However, prices recently broke above the top of the trading range ($61.00), possibly smashing this theory. |
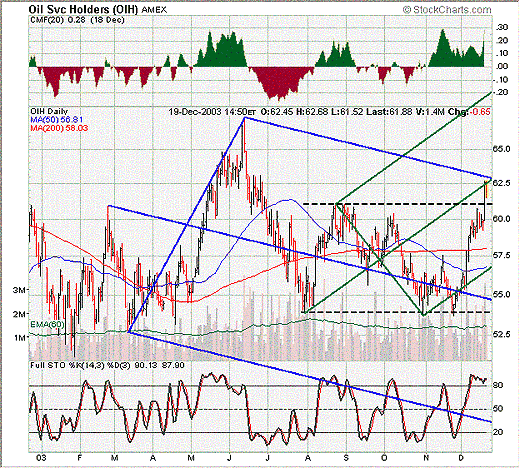
|
| Graphic provided by: Stockcharts.com. |
| |
| Despite the recent turn of events, I am not totally convinced yet that this is a legitimate breakout. More specifically, notice how the green median line and the top blue parallel line have both converged in the $62.50 to $63.00 range. Resistance here effectively turned back prices on Friday. As a result, the OIH needs to move above the $63.00 level for the recent breakout to be confirmed. If the OIH is successful in doing this, prices could rally up to the $68.00 to $75.00 range. To see how I calculate price targets based on trading range breakouts, please refer to prior articles of mine ("Brigham Exploration's Bullish Trading Range Formation," posted 11/24/03; and "Using Trading Ranges To Determine Future Price Movements," posted 11/14/03) on TradersAdvantage.com. |
Kevin has been a technical analyst for roughly 10 years now. Previously, Kevin owned his own business and acted as a registered investment advisor, specializing in energy. He was also a freelance oil analyst for Orient Trading Co., a commodity futures trading firm in Japan. Kevin is currently a freelance writer.
| Glen Allen, VA | |
| E-mail address: | hopson_1@yahoo.com |
Click here for more information about our publications!
Comments
Date:�12/23/03Rank:�5Comment:�
Date:�12/23/03Rank:�5Comment:�

Request Information From Our Sponsors
- StockCharts.com, Inc.
- Candle Patterns
- Candlestick Charting Explained
- Intermarket Technical Analysis
- John Murphy on Chart Analysis
- John Murphy's Chart Pattern Recognition
- John Murphy's Market Message
- MurphyExplainsMarketAnalysis-Intermarket Analysis
- MurphyExplainsMarketAnalysis-Visual Analysis
- StockCharts.com
- Technical Analysis of the Financial Markets
- The Visual Investor
- VectorVest, Inc.
- Executive Premier Workshop
- One-Day Options Course
- OptionsPro
- Retirement Income Workshop
- Sure-Fire Trading Systems (VectorVest, Inc.)
- Trading as a Business Workshop
- VectorVest 7 EOD
- VectorVest 7 RealTime/IntraDay
- VectorVest AutoTester
- VectorVest Educational Services
- VectorVest OnLine
- VectorVest Options Analyzer
- VectorVest ProGraphics v6.0
- VectorVest ProTrader 7
- VectorVest RealTime Derby Tool
- VectorVest Simulator
- VectorVest Variator
- VectorVest Watchdog