HOT TOPICS LIST
- MACD
- Fibonacci
- RSI
- Gann
- ADXR
- Stochastics
- Volume
- Triangles
- Futures
- Cycles
- Volatility
- ZIGZAG
- MESA
- Retracement
- Aroon
INDICATORS LIST
LIST OF TOPICS
PRINT THIS ARTICLE
by Gary Grosschadl
The Canadian Energy Index officially known as the S&P/TSX Capped Energy Index has broken through to a three year high.
Position: N/A
Gary Grosschadl
Independent Canadian equities trader and technical analyst based in Peterborough
Ontario, Canada.
PRINT THIS ARTICLE
ASCENDING TRIANGLES
TSX Energy Index At A Record High
12/19/03 08:06:00 AMby Gary Grosschadl
The Canadian Energy Index officially known as the S&P/TSX Capped Energy Index has broken through to a three year high.
Position: N/A
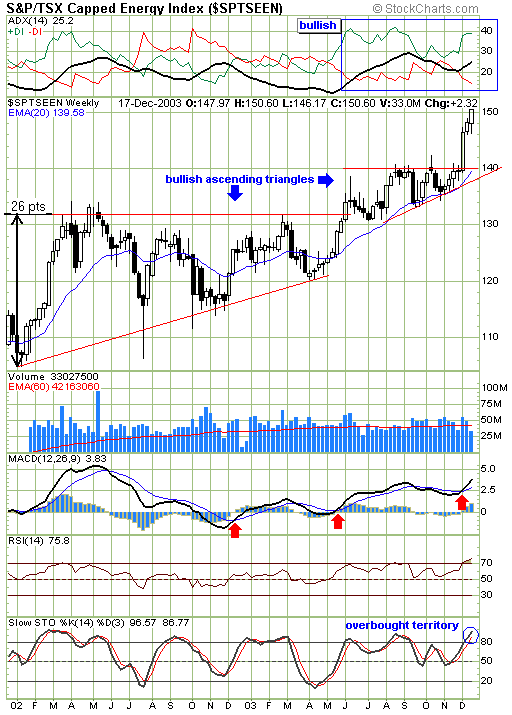
| This week the TSX (Toronto Stock Exchange) has broken above 8000, something it hasn't done in over two years. Energy stocks have been a factor here as this weekly chart illustrates. |
| Ascending triangles are bullish in nature (usually found as continuation patterns in an uptrend) and here are two, one stacked on the other. I have seen basing patterns such as channels or cup with handles stacked before, and powerful moves can come from this stacking effect. This example seems to fit the bill. This second smaller triangle can also be considered a consolidation before a bigger move evolves as has ocurred in the last three weeks. The upside target is measured from the widest part of the triangle (26 points in this example) and then applied to the breakout point : 132 + 26 = 158. |

|
| Weekly chart of the TSX Energy Index approaching a measured target. |
| Graphic provided by: Stockcharts.com. |
| |
| Several indicators are worth commenting on. The directional movement indicator on the top of the chart shows a distinct bullish transformation as the energy index breaks out of its first triangle. And it remains so with the ideal configuration of a rising ADX line being between the DIs with +DI on top. This shows trend strength growing, with the bulls (+DI) having the upper hand. |
| The MACD (moving average convergence/divergence) and the RSI (relative strength index) both show a rising trend in their graphs. Note the successively higher bullish crossovers in the MACD. The stochastics indicator reminds us that after such admirable gains the stock is in an overbought situation. A turn back down through the 80 level could be a signal that a downleg is in order but that has yet to occur. Once the target level of 158 is reached, traders should be wary of any reversal and the stochastics indicator will likely be one guide going forward. Note how the last two minor retracements were halted very near the stochastic mid-level of 50, something to monitor during the next stochastic downturn. |
Independent Canadian equities trader and technical analyst based in Peterborough
Ontario, Canada.
| Website: | www.whatsonsale.ca/financial.html |
| E-mail address: | gwg7@sympatico.ca |
Click here for more information about our publications!
PRINT THIS ARTICLE

Request Information From Our Sponsors
- StockCharts.com, Inc.
- Candle Patterns
- Candlestick Charting Explained
- Intermarket Technical Analysis
- John Murphy on Chart Analysis
- John Murphy's Chart Pattern Recognition
- John Murphy's Market Message
- MurphyExplainsMarketAnalysis-Intermarket Analysis
- MurphyExplainsMarketAnalysis-Visual Analysis
- StockCharts.com
- Technical Analysis of the Financial Markets
- The Visual Investor
- VectorVest, Inc.
- Executive Premier Workshop
- One-Day Options Course
- OptionsPro
- Retirement Income Workshop
- Sure-Fire Trading Systems (VectorVest, Inc.)
- Trading as a Business Workshop
- VectorVest 7 EOD
- VectorVest 7 RealTime/IntraDay
- VectorVest AutoTester
- VectorVest Educational Services
- VectorVest OnLine
- VectorVest Options Analyzer
- VectorVest ProGraphics v6.0
- VectorVest ProTrader 7
- VectorVest RealTime Derby Tool
- VectorVest Simulator
- VectorVest Variator
- VectorVest Watchdog
