HOT TOPICS LIST
- MACD
- Fibonacci
- RSI
- Gann
- ADXR
- Stochastics
- Volume
- Triangles
- Futures
- Cycles
- Volatility
- ZIGZAG
- MESA
- Retracement
- Aroon
INDICATORS LIST
LIST OF TOPICS
PRINT THIS ARTICLE
by Gary Grosschadl
After a big downleg, this retailer appears ready for a bounce.
Position: Buy
Gary Grosschadl
Independent Canadian equities trader and technical analyst based in Peterborough
Ontario, Canada.
PRINT THIS ARTICLE
CHART ANALYSIS
Sears, Roebuck & Co. Tries A Bounce
12/18/03 10:23:43 AMby Gary Grosschadl
After a big downleg, this retailer appears ready for a bounce.
Position: Buy
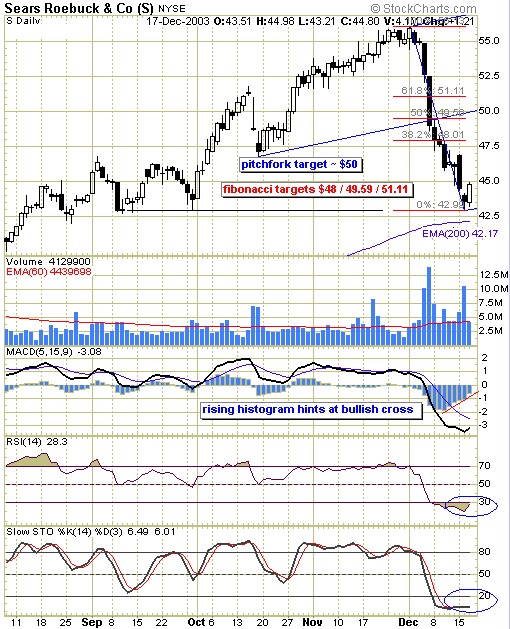
| Today's (December 17, 2003) bullish session is the first reversal day for Sears [S], where the stock closed above its previous day's high since it began its decline at the $55 level. A bullish engulfing candlestick also formed. Engulfing candlesticks, where the present day's candle body "engulfs" the previous day's body, are often a reliable turning point at the end of a lengthy decline. The displayed indicators show that Sears is at oversold levels but no definite signs of a turn are showing on the stochastics indicator. But on the RSI (relative strength index) and the short-term MACD, a hook is forming. More promising is the MACD (moving average convergence/divergence) histogram which is showing a positive divergence. In 1986, Thomas Aspray developed the MACD-histogram as a way of anticipating MACD crossovers. The MACD-histogram represents the difference between MACD and the 9-day EMA of MACD, also known as the signal or trigger line. The plot of this difference is shown as a histogram, making center line crossovers and divergences easier to identify. In this case, increases in the MACD-histogram indicate that MACD is rising faster than its 9-day EMA and bullish momentum is strengthening. This often is an excellent indication of a coming MACD bullish crossover. |
| To determine upside targets, a pitchfork has been drawn in as well as several Fibonacci levels. Should the stock make a further move north, a move to the pitchfork's median line of $50 is suggested. Using this supposed low and the previous high above $55, Fibonacci levels are generated. Two levels short of the median line target -- at $48 and $49.59 -- are shown at the 38.2% and 50% levels. |

|
| Daily chart showing a probable bounce. |
| Graphic provided by: Stockcharts.com. |
| |
| Short-term traders should be alert for any reversal or stall signs at or near any of those targets should this bottom turn develop into a decent upleg. An unexpected reversal in the next day or two that brings the stock down to a new low will negate the bullish intent discussed here. |
Independent Canadian equities trader and technical analyst based in Peterborough
Ontario, Canada.
| Website: | www.whatsonsale.ca/financial.html |
| E-mail address: | gwg7@sympatico.ca |
Click here for more information about our publications!
Comments
Date: 12/20/03Rank: 4Comment:
Date: 12/21/03Rank: 5Comment:

Request Information From Our Sponsors
- StockCharts.com, Inc.
- Candle Patterns
- Candlestick Charting Explained
- Intermarket Technical Analysis
- John Murphy on Chart Analysis
- John Murphy's Chart Pattern Recognition
- John Murphy's Market Message
- MurphyExplainsMarketAnalysis-Intermarket Analysis
- MurphyExplainsMarketAnalysis-Visual Analysis
- StockCharts.com
- Technical Analysis of the Financial Markets
- The Visual Investor
- VectorVest, Inc.
- Executive Premier Workshop
- One-Day Options Course
- OptionsPro
- Retirement Income Workshop
- Sure-Fire Trading Systems (VectorVest, Inc.)
- Trading as a Business Workshop
- VectorVest 7 EOD
- VectorVest 7 RealTime/IntraDay
- VectorVest AutoTester
- VectorVest Educational Services
- VectorVest OnLine
- VectorVest Options Analyzer
- VectorVest ProGraphics v6.0
- VectorVest ProTrader 7
- VectorVest RealTime Derby Tool
- VectorVest Simulator
- VectorVest Variator
- VectorVest Watchdog
