HOT TOPICS LIST
- MACD
- Fibonacci
- RSI
- Gann
- ADXR
- Stochastics
- Volume
- Triangles
- Futures
- Cycles
- Volatility
- ZIGZAG
- MESA
- Retracement
- Aroon
INDICATORS LIST
LIST OF TOPICS
PRINT THIS ARTICLE
by David Penn
The Dow Transports set a new high in December--barely. Now a bearish stochastic divergence, 2B test of top, and a mildly overbought market may force a test of support at the 50-day EMA.
Position: N/A
David Penn
Technical Writer for Technical Analysis of STOCKS & COMMODITIES magazine, Working-Money.com, and Traders.com Advantage.
PRINT THIS ARTICLE
DOW THEORY
Transport Trouble
12/18/03 10:34:21 AMby David Penn
The Dow Transports set a new high in December--barely. Now a bearish stochastic divergence, 2B test of top, and a mildly overbought market may force a test of support at the 50-day EMA.
Position: N/A
| At the beginning of December, in a piece for Traders.com Advantage ("Dow 3,000," December 4, 2003), I wrote that, after matching each other high for high and low for low since August, the Dow Transports were in danger of not confirming the more recent highs of the Dow Industrials. The mark, I suggested, was a Dow Transport move above 3,000. Without that, it would be difficult to imagine the Dow Industrials -- to say nothing of the broader market -- continuing to advance in the face of such a clear-cut Dow theory non-confirmation. |
| Thus, like a student who rushed to turn in a term paper before his professor left for the semester's end, the Dow Tranports reached 3,000 in December. But only barely -- and even then the Transports still failed (as of this writing) to close above 3,000. So, however begrudgingly, the Transports must be said to have "confirmed" the new highs in the Industrials -- even if this is more to the letter and less to the spirit of Dow theory confirmation. |

|
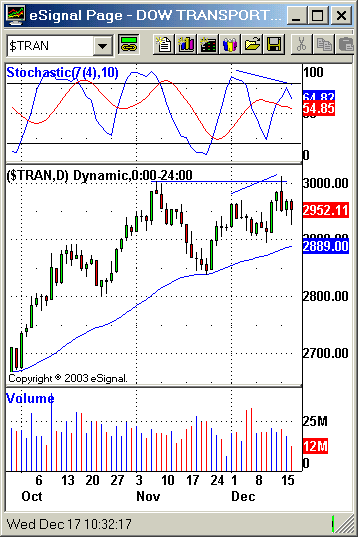
| Will a near-term correction in the Transports find support at the 50-day EMA? |
| Graphic provided by: eSignal. |
| |
| But the technical points seem increasingly stacked against the Transports' continuing to move higher in the near-term. Foremost among these points is the negative divergence between the stochastic oscillator and price action in the month of December. Whereas the stochastic was higher at the early December peak than it was at the mid-December peak, the price action in the Transports shows consecutively higher peaks. The phenomenon, when prices make a higher high yet the oscillator makes a lower high, is a bearish divergence and tends to anticipate softer (i.e., lower) prices going forward. |
| Another factor against near-term gains in the Dow Transports is a 2B test of top between the November high at 3002.52 and the slightly higher December high of 3010.74. The 2B test of top occurs when prices make a high, pull back, and then record a higher high but fail to follow through. This failure to follow-through can be in the form of the higher high being a reversal day which takes prices below even the level of the previous high (in this case, a December high that traded lower than 3002 or so), or it can be a follow-up down day. In either instance, the idea behind a 2B test (or the other variations, such as Connor's "Turtle Soup" set-up) is that when prices do not follow through to the upside fairly immediately after a new high, the possibility for a reversal can be great. Here, with the Dow Transports, there has been an obvious absence of follow-up strength to the upside that cannot be ignored. |
| It also should not be ignored that the Dow Transports have been in a powerful uptrend for months, and that the 50-day exponential moving average has been a reliable source of support for the Transports since the Transports broke out in March at 2150. But the road ahead looks like it might be increasingly tough going for the bulls. And, at least from a technical perspective, the bearish portents in the stochastic and through the lens of the 2B test of top help explain why. |
Technical Writer for Technical Analysis of STOCKS & COMMODITIES magazine, Working-Money.com, and Traders.com Advantage.
| Title: | Technical Writer |
| Company: | Technical Analysis, Inc. |
| Address: | 4757 California Avenue SW |
| Seattle, WA 98116 | |
| Phone # for sales: | 206 938 0570 |
| Fax: | 206 938 1307 |
| Website: | www.Traders.com |
| E-mail address: | DPenn@traders.com |
Traders' Resource Links | |
| Charting the Stock Market: The Wyckoff Method -- Books | |
| Working-Money.com -- Online Trading Services | |
| Traders.com Advantage -- Online Trading Services | |
| Technical Analysis of Stocks & Commodities -- Publications and Newsletters | |
| Working Money, at Working-Money.com -- Publications and Newsletters | |
| Traders.com Advantage -- Publications and Newsletters | |
| Professional Traders Starter Kit -- Software | |
Click here for more information about our publications!
Comments
Date: 12/18/03Rank: 5Comment:
Date: 12/20/03Rank: 4Comment:
Date: 12/21/03Rank: 5Comment:

Request Information From Our Sponsors
- StockCharts.com, Inc.
- Candle Patterns
- Candlestick Charting Explained
- Intermarket Technical Analysis
- John Murphy on Chart Analysis
- John Murphy's Chart Pattern Recognition
- John Murphy's Market Message
- MurphyExplainsMarketAnalysis-Intermarket Analysis
- MurphyExplainsMarketAnalysis-Visual Analysis
- StockCharts.com
- Technical Analysis of the Financial Markets
- The Visual Investor
- VectorVest, Inc.
- Executive Premier Workshop
- One-Day Options Course
- OptionsPro
- Retirement Income Workshop
- Sure-Fire Trading Systems (VectorVest, Inc.)
- Trading as a Business Workshop
- VectorVest 7 EOD
- VectorVest 7 RealTime/IntraDay
- VectorVest AutoTester
- VectorVest Educational Services
- VectorVest OnLine
- VectorVest Options Analyzer
- VectorVest ProGraphics v6.0
- VectorVest ProTrader 7
- VectorVest RealTime Derby Tool
- VectorVest Simulator
- VectorVest Variator
- VectorVest Watchdog
