HOT TOPICS LIST
- MACD
- Fibonacci
- RSI
- Gann
- ADXR
- Stochastics
- Volume
- Triangles
- Futures
- Cycles
- Volatility
- ZIGZAG
- MESA
- Retracement
- Aroon
INDICATORS LIST
LIST OF TOPICS
PRINT THIS ARTICLE
by David Penn
A bearish divergence then, an island gap now ... FedEx looks lower.
Position: N/A
David Penn
Technical Writer for Technical Analysis of STOCKS & COMMODITIES magazine, Working-Money.com, and Traders.com Advantage.
PRINT THIS ARTICLE
GAPS
FedEx Fallout
12/18/03 11:42:37 AMby David Penn
A bearish divergence then, an island gap now ... FedEx looks lower.
Position: N/A
| In a recent Traders.com Advantage article ("Dow 3000," December 4, 2003), I attempted to draw attention to the Dow Transports' need to confirm the new highs made by the Dow Industrials. That the Transports have struggled to do so (see my upcoming "Transport Trouble" for Traders.com Advantage) is all too apparent, and does not bode well for the broader stock market. |
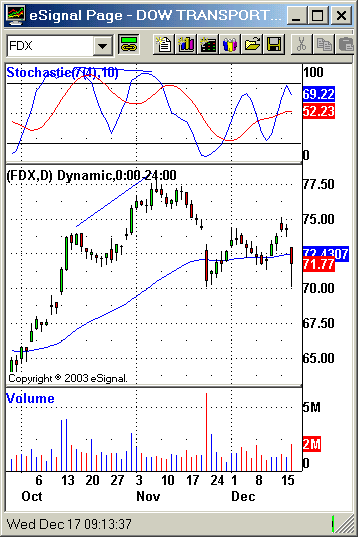
| The trade in FedEx, a component of the Dow Transports, has exemplified the problem the Transports have endured in the past few months. Note first the bearish divergence between the stochastic oscillator (7, 10) and the October and November highs in FedEx. The stochastic is slightly higher at the October high than it is at the November high. Yet in terms of price action, FedEx's October high is significantly lower than its November high. This is a classic bearish divergence between an oscillator and price action, the result of which was the sharp decline that hit FedEx in mid-November, as its share price dropped from the November high of 77.50 to as low as 70.00. |

|
| Following the sharp sell-off in mid-November, FDX finds support at 70. |
| Graphic provided by: eSignal. |
| |
| Shares of FedEx rallied in post-Thanksgiving trade into December, rising above the 50-day exponential moving average. In fact, a test of support at the 50-day EMA near the middle of the month led to another push upward for the stock, which reached an intraday high above 75.00. However, this rally was short-lived as FedEx again gapped down beneath the 50-day EMA. |
| The gaps in late November and again in mid to late December have formed an island on FedEx's price chart. The question at this point is whether or not this island will represent an island reversal or merely an island gap from which further price declines can be expected. Most alarming for those who are inclined to pursue the bullish case for FedEx is the fact that the market for FedEx still seems quite overbought. When FedEx last tested support at 70, the market was sufficiently oversold that the stock bounced 5 points. However, the most recent test of support at 70 revealed a market that, at 70, was still overbought. |
| The intermediate trend for FedEx is up. So there should be little rush to adopt the bearish case. But the combination of weakness in the Dow Transports, bearish gaps (the first on exceptionally high volume), and an overbought market seem to argue against the attractiveness of FedEx right now. |
Technical Writer for Technical Analysis of STOCKS & COMMODITIES magazine, Working-Money.com, and Traders.com Advantage.
| Title: | Technical Writer |
| Company: | Technical Analysis, Inc. |
| Address: | 4757 California Avenue SW |
| Seattle, WA 98116 | |
| Phone # for sales: | 206 938 0570 |
| Fax: | 206 938 1307 |
| Website: | www.Traders.com |
| E-mail address: | DPenn@traders.com |
Traders' Resource Links | |
| Charting the Stock Market: The Wyckoff Method -- Books | |
| Working-Money.com -- Online Trading Services | |
| Traders.com Advantage -- Online Trading Services | |
| Technical Analysis of Stocks & Commodities -- Publications and Newsletters | |
| Working Money, at Working-Money.com -- Publications and Newsletters | |
| Traders.com Advantage -- Publications and Newsletters | |
| Professional Traders Starter Kit -- Software | |
Click here for more information about our publications!
Comments
Date: 12/21/03Rank: 3Comment:

Request Information From Our Sponsors
- StockCharts.com, Inc.
- Candle Patterns
- Candlestick Charting Explained
- Intermarket Technical Analysis
- John Murphy on Chart Analysis
- John Murphy's Chart Pattern Recognition
- John Murphy's Market Message
- MurphyExplainsMarketAnalysis-Intermarket Analysis
- MurphyExplainsMarketAnalysis-Visual Analysis
- StockCharts.com
- Technical Analysis of the Financial Markets
- The Visual Investor
- VectorVest, Inc.
- Executive Premier Workshop
- One-Day Options Course
- OptionsPro
- Retirement Income Workshop
- Sure-Fire Trading Systems (VectorVest, Inc.)
- Trading as a Business Workshop
- VectorVest 7 EOD
- VectorVest 7 RealTime/IntraDay
- VectorVest AutoTester
- VectorVest Educational Services
- VectorVest OnLine
- VectorVest Options Analyzer
- VectorVest ProGraphics v6.0
- VectorVest ProTrader 7
- VectorVest RealTime Derby Tool
- VectorVest Simulator
- VectorVest Variator
- VectorVest Watchdog
