HOT TOPICS LIST
- MACD
- Fibonacci
- RSI
- Gann
- ADXR
- Stochastics
- Volume
- Triangles
- Futures
- Cycles
- Volatility
- ZIGZAG
- MESA
- Retracement
- Aroon
INDICATORS LIST
LIST OF TOPICS
PRINT THIS ARTICLE
by Gary Grosschadl
This tech stock is flirting with a major reversal pattern and may not evade a serious slide as it did last week.
Position: Sell
Gary Grosschadl
Independent Canadian equities trader and technical analyst based in Peterborough
Ontario, Canada.
PRINT THIS ARTICLE
DOUBLE TOPS
Broadcom Corporation Being Broadsided
12/16/03 07:59:38 AMby Gary Grosschadl
This tech stock is flirting with a major reversal pattern and may not evade a serious slide as it did last week.
Position: Sell
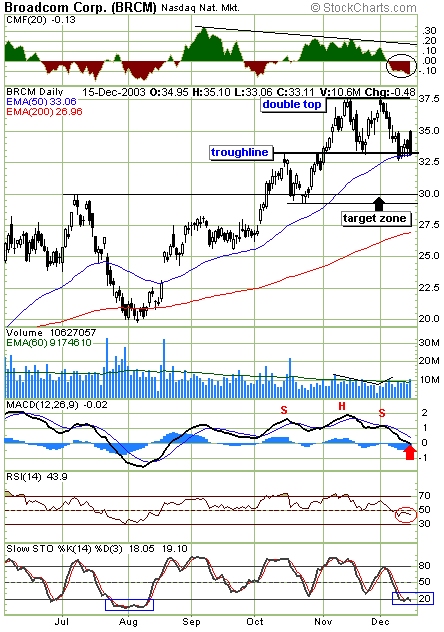
| The daily chart for Broadcom (BRCM) shows a clear double top pattern with the stock testing its troughline for the second time in a week. This troughline is well placed, being at the 50-day EMA making it especially significant. |
| The volume considerations are also correct. There was lower volume at the second peak (showing less conviction by the bulls) and an expansion in volume during the decline from the second peak. Increasing volume as the stock declines below the troughline would be the next volume characteristic to look for in the days ahead. |

|
| Daily chart showing a double top formation. |
| Graphic provided by: Stockcharts.com. |
| |
| By measurement (top to trough as applied to the downside break of troughline), the target zone for this double top, should it fulfill to completion, is the $30 area. This lines up with previous resistance from back in July along with hammer-like candlesticks in late October. |
| Several indicators also paint a bleak picture. The CMF or Chaikin money flow indicator shows a decline off a telling negative divergence that has resulted in a move into negative territory, showing extra bearish potential. The MACD or moving average convergence/divergence indicator shows two bearish signs: Its own head and shoulders top and a potential move below the zero line. The RSI or relative strength index shows a move below the often key 50 level, something that has not occured since the stock made a bold move off its $20 bottom last August. The stochastics oscillator shows an oversold situation, however this can stay oversold for an extended time as was shown last August. |
| Last week's bounce off the troughline looked hopeful to the bulls but to have this line retested so soon afterwards does not bode well for the near future. Traders should watch this line carefully as short sellers may be targeting an opportunity soon to be realized. |
Independent Canadian equities trader and technical analyst based in Peterborough
Ontario, Canada.
| Website: | www.whatsonsale.ca/financial.html |
| E-mail address: | gwg7@sympatico.ca |
Click here for more information about our publications!
PRINT THIS ARTICLE

Request Information From Our Sponsors
- StockCharts.com, Inc.
- Candle Patterns
- Candlestick Charting Explained
- Intermarket Technical Analysis
- John Murphy on Chart Analysis
- John Murphy's Chart Pattern Recognition
- John Murphy's Market Message
- MurphyExplainsMarketAnalysis-Intermarket Analysis
- MurphyExplainsMarketAnalysis-Visual Analysis
- StockCharts.com
- Technical Analysis of the Financial Markets
- The Visual Investor
- VectorVest, Inc.
- Executive Premier Workshop
- One-Day Options Course
- OptionsPro
- Retirement Income Workshop
- Sure-Fire Trading Systems (VectorVest, Inc.)
- Trading as a Business Workshop
- VectorVest 7 EOD
- VectorVest 7 RealTime/IntraDay
- VectorVest AutoTester
- VectorVest Educational Services
- VectorVest OnLine
- VectorVest Options Analyzer
- VectorVest ProGraphics v6.0
- VectorVest ProTrader 7
- VectorVest RealTime Derby Tool
- VectorVest Simulator
- VectorVest Variator
- VectorVest Watchdog
