

HOT TOPICS LIST
- MACD
- Fibonacci
- RSI
- Gann
- ADXR
- Stochastics
- Volume
- Triangles
- Futures
- Cycles
- Volatility
- ZIGZAG
- MESA
- Retracement
- Aroon
INDICATORS LIST
LIST OF TOPICS
PRINT THIS ARTICLE
by David Penn
The bullish flag in Cadence Design (CDN) is another symbol of the rebound in software stocks.
Position: N/A
David Penn
Technical Writer for Technical Analysis of STOCKS & COMMODITIES magazine, Working-Money.com, and Traders.com Advantage.
PRINT THIS ARTICLE
FLAGS AND PENNANTS
Cadence Design Systems' Bullish Flag
12/15/03 10:51:05 AMby David Penn
The bullish flag in Cadence Design (CDN) is another symbol of the rebound in software stocks.
Position: N/A
| One of the best ways (some might say only) to buy a stock in a rising market is to buy it as it retraces toward a major intermediate-term moving average. And one of the more common routes by which prices pull back during uptrends is the flag. A flag, which has both bullish and bearish manifestations, is a short series of countertrend bars bounded by parallel trendlines. With a flag, two things are paramount: the shortness of the countertrend movement (a few days is preferable) and the parallel nature of the bounding trendlines (converging trendlines form a pennant). |
| While software stocks as a group ($GSO) have traded in a range since breaking out in late August, some components of this group have been in rising uptrends since at least mid-October. As the $GSO moved from significantly oversold territory in early December, attention shifts to those stocks in the group that may be taking greatest advantage of this sector-wide development. |
|
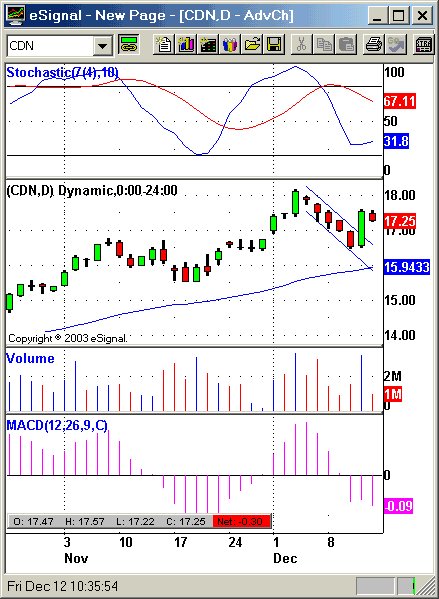
| This bullish flag in CDN sets up an opportunity for a rebound and test of the early December highs. |
| Graphic provided by: eSignal. |
| |
| Cadence Design Systems appears to be among the stronger software stocks at present. Trading above its 50-day exponential moving average since mid-October, CDN has gained some 38% since that time to its recent high on December 3rd. Unfortunately for those looking to take advantage of CDN's strength, the stock is quite extended from its 50-day EMA. Buying the stock at $18 in early December would have potentially exposed an investor to a pullback to that moving average -- a pullback that would have been worth as many as $2 per share. |
| CDN did in fact pull back toward the 50-day EMA in a series of five consecutive down days that brought the stock to a closing low of $16.50. By the way this decline can be neatly bounded by a set of parallel trendlines, we can be on the look out for a bullish flag formation that, should prices find support at the 50-day EMA, could propel CDN back upward, perhaps to a test of the high just north of $18. So far, this appears to be exactly what is taking place. CDN fell as low as $16.50 before bouncing back upward in a wide-ranging day to as high as $17.40. This wide-ranging day represented a breakout from the bullish flag formation, and suggests that higher prices for CDN are likely. |
| How much higher? The measurement rule for flags involves measuring the distance from the begining of the rally leading up to the flag to the top of the formation, and adding this amount to the value at the breakout point. In the case of CDN, the pre-flag rally is approximately 2.5 (18 - 15.5) which, when added to the value of 17 at the breakout, points to an initial upside of 19.5 and a new 52-week high for CDN. |
Technical Writer for Technical Analysis of STOCKS & COMMODITIES magazine, Working-Money.com, and Traders.com Advantage.
| Title: | Technical Writer |
| Company: | Technical Analysis, Inc. |
| Address: | 4757 California Avenue SW |
| Seattle, WA 98116 | |
| Phone # for sales: | 206 938 0570 |
| Fax: | 206 938 1307 |
| Website: | www.Traders.com |
| E-mail address: | DPenn@traders.com |
Traders' Resource Links | |
| Charting the Stock Market: The Wyckoff Method -- Books | |
| Working-Money.com -- Online Trading Services | |
| Traders.com Advantage -- Online Trading Services | |
| Technical Analysis of Stocks & Commodities -- Publications and Newsletters | |
| Working Money, at Working-Money.com -- Publications and Newsletters | |
| Traders.com Advantage -- Publications and Newsletters | |
| Professional Traders Starter Kit -- Software | |
Click here for more information about our publications!
PRINT THIS ARTICLE

Request Information From Our Sponsors
- VectorVest, Inc.
- Executive Premier Workshop
- One-Day Options Course
- OptionsPro
- Retirement Income Workshop
- Sure-Fire Trading Systems (VectorVest, Inc.)
- Trading as a Business Workshop
- VectorVest 7 EOD
- VectorVest 7 RealTime/IntraDay
- VectorVest AutoTester
- VectorVest Educational Services
- VectorVest OnLine
- VectorVest Options Analyzer
- VectorVest ProGraphics v6.0
- VectorVest ProTrader 7
- VectorVest RealTime Derby Tool
- VectorVest Simulator
- VectorVest Variator
- VectorVest Watchdog
- StockCharts.com, Inc.
- Candle Patterns
- Candlestick Charting Explained
- Intermarket Technical Analysis
- John Murphy on Chart Analysis
- John Murphy's Chart Pattern Recognition
- John Murphy's Market Message
- MurphyExplainsMarketAnalysis-Intermarket Analysis
- MurphyExplainsMarketAnalysis-Visual Analysis
- StockCharts.com
- Technical Analysis of the Financial Markets
- The Visual Investor