HOT TOPICS LIST
- MACD
- Fibonacci
- RSI
- Gann
- ADXR
- Stochastics
- Volume
- Triangles
- Futures
- Cycles
- Volatility
- ZIGZAG
- MESA
- Retracement
- Aroon
INDICATORS LIST
LIST OF TOPICS
PRINT THIS ARTICLE
by Kevin Hopson
Though the S&P 500 has been resilient in recent months, the index is showing signs of vulnerability.
Position: N/A
Kevin Hopson
Kevin has been a technical analyst for roughly 10 years now. Previously, Kevin owned his own business and acted as a registered investment advisor, specializing in energy. He was also a freelance oil analyst for Orient Trading Co., a commodity futures trading firm in Japan. Kevin is currently a freelance writer.
PRINT THIS ARTICLE
WEDGE FORMATIONS
The S&P 500 Looks Susceptible To A Breakdown
12/12/03 08:42:27 AMby Kevin Hopson
Though the S&P 500 has been resilient in recent months, the index is showing signs of vulnerability.
Position: N/A
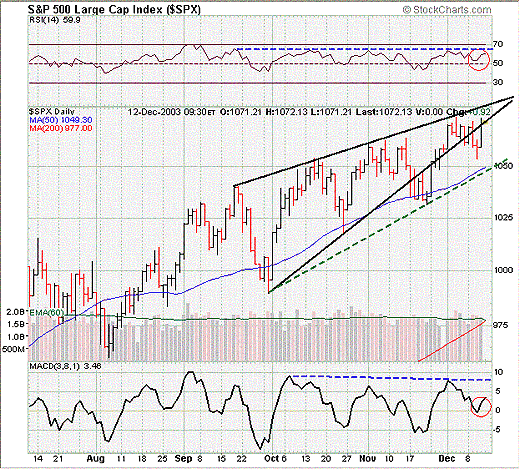
| Though the S&P 500 Index (SPX) has continued to find support along its 50-day moving average (1049) during its late summer and fall rally, there are some concerning signs for the bulls. For one thing, the index has been unable to move above the top of a rising wedge formation, which it broke to the downside from back in mid-November. This wedge formation is illustrated by the black trendlines. The upper trendline is the one I am referring to. As you can see, the index has continued to find resistance here as it moves higher. |
| Though this is not necessarily a bearish sign, the fact that the relative strength index (RSI) and moving average convergence/divergence (MACD) have not confirmed the rally is uncomforting. In other words, the RSI has been moving sideways during the recent run-up in prices, while the MACD has actually been putting in lower highs. These are known as bearish divergences and typically signal a forthcoming top in prices. |

|
| Graphic provided by: Stockcharts.com. |
| |
| Additionally, just because the 50-day moving average kept the index from selling off after November's rising wedge breakdown does not mean that this was a false alarm. More specifically, if you look at the new uptrend line (as illustrated by the dotted green line), you will see that this could very well be the bottom of a new rising wedge formation. Though it will likely take longer to play out given the less steep uptrend line, which would allow further upside potential in the near-term, the end result could be negative. In other words, since rising wedge formations normally break to the downside, the SPX looks vulnerable to a significant sell-off further down the road. |
Kevin has been a technical analyst for roughly 10 years now. Previously, Kevin owned his own business and acted as a registered investment advisor, specializing in energy. He was also a freelance oil analyst for Orient Trading Co., a commodity futures trading firm in Japan. Kevin is currently a freelance writer.
| Glen Allen, VA | |
| E-mail address: | hopson_1@yahoo.com |
Click here for more information about our publications!
Comments
Date: 12/14/03Rank: 5Comment:
Date: 12/19/03Rank: 4Comment:

Request Information From Our Sponsors
- StockCharts.com, Inc.
- Candle Patterns
- Candlestick Charting Explained
- Intermarket Technical Analysis
- John Murphy on Chart Analysis
- John Murphy's Chart Pattern Recognition
- John Murphy's Market Message
- MurphyExplainsMarketAnalysis-Intermarket Analysis
- MurphyExplainsMarketAnalysis-Visual Analysis
- StockCharts.com
- Technical Analysis of the Financial Markets
- The Visual Investor
- VectorVest, Inc.
- Executive Premier Workshop
- One-Day Options Course
- OptionsPro
- Retirement Income Workshop
- Sure-Fire Trading Systems (VectorVest, Inc.)
- Trading as a Business Workshop
- VectorVest 7 EOD
- VectorVest 7 RealTime/IntraDay
- VectorVest AutoTester
- VectorVest Educational Services
- VectorVest OnLine
- VectorVest Options Analyzer
- VectorVest ProGraphics v6.0
- VectorVest ProTrader 7
- VectorVest RealTime Derby Tool
- VectorVest Simulator
- VectorVest Variator
- VectorVest Watchdog
