

HOT TOPICS LIST
- MACD
- Fibonacci
- RSI
- Gann
- ADXR
- Stochastics
- Volume
- Triangles
- Futures
- Cycles
- Volatility
- ZIGZAG
- MESA
- Retracement
- Aroon
INDICATORS LIST
LIST OF TOPICS
PRINT THIS ARTICLE
by Gary Grosschadl
This beleagured Canadian company has a one year trading range of $4.85 - $0.93 and now tries to breakout of a trading range.
Position: Buy
Gary Grosschadl
Independent Canadian equities trader and technical analyst based in Peterborough
Ontario, Canada.
PRINT THIS ARTICLE
CHANNEL LINES
A Troubled Steel Company Attempts A Turnaround
12/12/03 09:06:54 AMby Gary Grosschadl
This beleagured Canadian company has a one year trading range of $4.85 - $0.93 and now tries to breakout of a trading range.
Position: Buy
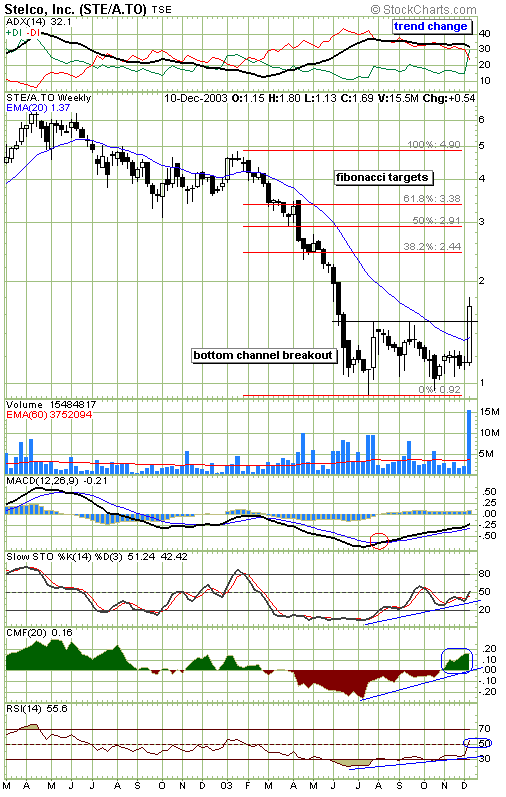
| Stelco Inc. is trying to rise on the back of a growing steel demand and improving prices. While stronger steel companies have already enjoyed good gains this one has been a laggard, but the chart pattern is more hopeful of a possible turn in the making. |
| This weekly chart shows Stelco making a move above a bottom channel while at the same time making its first bold thrust above its 20-period moving averge since its big fall from $4. The question is, will this rise be sustainable? |
|
| Weekly chart show's Stelco's early bullish promise. |
| Graphic provided by: Stockcharts.com. |
| |
| A good break above a trading range or channel, especially one found in a basing pattern, usually needs convincing volume to do so. This is certainly the case here as the volume spike shows, even here at mid-week. So the true weekly volume will be even more convincing. Of course the weekly close also needs to finish above the top channel to maintain this bullish drive. |
| Several indicators also reflect the bullish promise here. The directional movement indicator at the top of the chart shows a bullish trend change in the making. The crossing over of the DI lines signals that bullish power is gaining the upper hand. The ADX line measures trend strength while the DI lines show the power of bullish and bearish forces and a cross usually means a change in trend especially if the ADX line is above 25. |
| The indicators below the chart all began showing a rising trend while the stock was going sideways. The CMF indicator (Chaiken money flow) is particularily noteworthy as not only did it signal a bullish divergence to the stock's sideways action but it turned positive before the breakout move. This indicator measures supply and demand in the form of buying and selling pressure and can be very telling at times, this being a good example. A weekly close above the top channel line sets the stage for a possible drive to the first Fibonacci target of $2.44. Short-term traders should be alert for any signs of reversal at or near that mark, should this bullish drive prevail. |
Independent Canadian equities trader and technical analyst based in Peterborough
Ontario, Canada.
| Website: | www.whatsonsale.ca/financial.html |
| E-mail address: | gwg7@sympatico.ca |
Click here for more information about our publications!
PRINT THIS ARTICLE

Request Information From Our Sponsors
- StockCharts.com, Inc.
- Candle Patterns
- Candlestick Charting Explained
- Intermarket Technical Analysis
- John Murphy on Chart Analysis
- John Murphy's Chart Pattern Recognition
- John Murphy's Market Message
- MurphyExplainsMarketAnalysis-Intermarket Analysis
- MurphyExplainsMarketAnalysis-Visual Analysis
- StockCharts.com
- Technical Analysis of the Financial Markets
- The Visual Investor
- VectorVest, Inc.
- Executive Premier Workshop
- One-Day Options Course
- OptionsPro
- Retirement Income Workshop
- Sure-Fire Trading Systems (VectorVest, Inc.)
- Trading as a Business Workshop
- VectorVest 7 EOD
- VectorVest 7 RealTime/IntraDay
- VectorVest AutoTester
- VectorVest Educational Services
- VectorVest OnLine
- VectorVest Options Analyzer
- VectorVest ProGraphics v6.0
- VectorVest ProTrader 7
- VectorVest RealTime Derby Tool
- VectorVest Simulator
- VectorVest Variator
- VectorVest Watchdog