HOT TOPICS LIST
- MACD
- Fibonacci
- RSI
- Gann
- ADXR
- Stochastics
- Volume
- Triangles
- Futures
- Cycles
- Volatility
- ZIGZAG
- MESA
- Retracement
- Aroon
INDICATORS LIST
LIST OF TOPICS
PRINT THIS ARTICLE
by Kevin Hopson
The Lehman 20+ Year Treasury Bond Fund (iShares) is showing signs of breaking down, which could signal higher interest rates down the road.
Position: Sell
Kevin Hopson
Kevin has been a technical analyst for roughly 10 years now. Previously, Kevin owned his own business and acted as a registered investment advisor, specializing in energy. He was also a freelance oil analyst for Orient Trading Co., a commodity futures trading firm in Japan. Kevin is currently a freelance writer.
PRINT THIS ARTICLE
TRIANGLES
Are Higher Interest Rates On The Horizon?
12/11/03 11:50:07 AMby Kevin Hopson
The Lehman 20+ Year Treasury Bond Fund (iShares) is showing signs of breaking down, which could signal higher interest rates down the road.
Position: Sell
| As many of you know, interest rates have been at historically low levels for some time now. After analyzing the U.S. Dollar Index ($USD) a few days ago, I was wondering if the interest rate picture supported my theory for a potential bottom reversal in the U.S. dollar. Though there are various investment vehicles that track both interest rates and bond prices, I decided to look at the iShares Lehman 20+ Year Treasury Bond Fund (TLT), which trades like a stock. When analyzing the chart, I came across some interesting developments. |
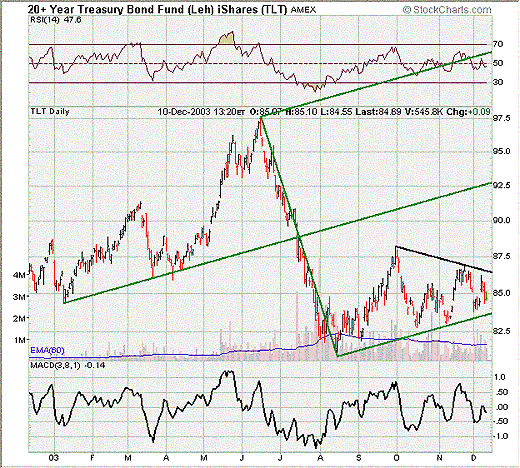
| For example, if you look at the one-year chart for the TLT, you will notice that the fund has formed a triangle. This is illustrated by the black downtrend line and the bottom parallel (uptrend) line of the green pitchfork. Triangle formations - symmetrical in nature - tend to be continuation patterns. Since this formation developed after a steep sell-off, I would consider it a bearish triangle. In other words, there is a good possibility that these shares (and bond prices in general) could eventually break to the downside. Since bond prices fall when interest rates rise, there seems to be speculation of higher rates down the road. |

|
| Graphic provided by: Stockcharts.com. |
| |
| Also supporting this theory is the green pitchfork configuration. More specifically, notice how prices failed to test the green median line before pulling back to the bottom parallel line. This is known as the "price failure" rule in pitchfork analysis. When this occurs, the bottom parallel line is usually broken at some point in the future. Since the bottom parallel line is also the bottom of the bearish triangle formation, this indicates a likely break to the downside. |
| Though I have not provided a chart of the fund, the Rydex Juno Investor Fund (RYJUX) shows the exact opposite occurring. In other words, the RYJUX has formed a triangle after a steep run-up in prices, which is often considered a bullish continuation pattern. Additionally, the RYJUX is displaying a positive price failure rule. More specifically, prices failed to test the median line of the pitchfork before rising back to the top parallel (downtrend) line. This is a sign of strength and usually results in a break to the upside. |
| Since the RYJUX is an inverse bond fund, meaning that prices tend to move in tandem with interest rates, a break to the upside would indicate speculation of higher interest rates. Higher interest rates - in turn - would positively impact the dollar and support my theory of a forthcoming bottom in the U.S. Dollar Index. As a result, I would be cautious on the TLT in the near-term and look to sell into strength. |
Kevin has been a technical analyst for roughly 10 years now. Previously, Kevin owned his own business and acted as a registered investment advisor, specializing in energy. He was also a freelance oil analyst for Orient Trading Co., a commodity futures trading firm in Japan. Kevin is currently a freelance writer.
| Glen Allen, VA | |
| E-mail address: | hopson_1@yahoo.com |
Click here for more information about our publications!
Comments
Date: 12/18/03Rank: 4Comment:

|

Request Information From Our Sponsors
- StockCharts.com, Inc.
- Candle Patterns
- Candlestick Charting Explained
- Intermarket Technical Analysis
- John Murphy on Chart Analysis
- John Murphy's Chart Pattern Recognition
- John Murphy's Market Message
- MurphyExplainsMarketAnalysis-Intermarket Analysis
- MurphyExplainsMarketAnalysis-Visual Analysis
- StockCharts.com
- Technical Analysis of the Financial Markets
- The Visual Investor
- VectorVest, Inc.
- Executive Premier Workshop
- One-Day Options Course
- OptionsPro
- Retirement Income Workshop
- Sure-Fire Trading Systems (VectorVest, Inc.)
- Trading as a Business Workshop
- VectorVest 7 EOD
- VectorVest 7 RealTime/IntraDay
- VectorVest AutoTester
- VectorVest Educational Services
- VectorVest OnLine
- VectorVest Options Analyzer
- VectorVest ProGraphics v6.0
- VectorVest ProTrader 7
- VectorVest RealTime Derby Tool
- VectorVest Simulator
- VectorVest Variator
- VectorVest Watchdog
