HOT TOPICS LIST
- MACD
- Fibonacci
- RSI
- Gann
- ADXR
- Stochastics
- Volume
- Triangles
- Futures
- Cycles
- Volatility
- ZIGZAG
- MESA
- Retracement
- Aroon
INDICATORS LIST
LIST OF TOPICS
PRINT THIS ARTICLE
by Matt Blackman
Insider selling continued at a brisk pace in November. The ratio of shares sold to purchased dropped slightly but overall sales were up significantly. There are other signs that the market may be at, or at least very near, a top.
Position: N/A
Matt Blackman
Matt Blackman is a full-time technical and financial writer and trader. He produces corporate and financial newsletters, and assists clients in getting published in the mainstream media. He is the host of TradeSystemGuru.com. Matt has earned the Chartered Market Technician (CMT) designation. Find out what stocks and futures Matt is watching on Twitter at www.twitter.com/RatioTrade
PRINT THIS ARTICLE
INSIDE BUY/SELL
More Signs Of A Market Top
12/11/03 08:23:46 AMby Matt Blackman
Insider selling continued at a brisk pace in November. The ratio of shares sold to purchased dropped slightly but overall sales were up significantly. There are other signs that the market may be at, or at least very near, a top.
Position: N/A
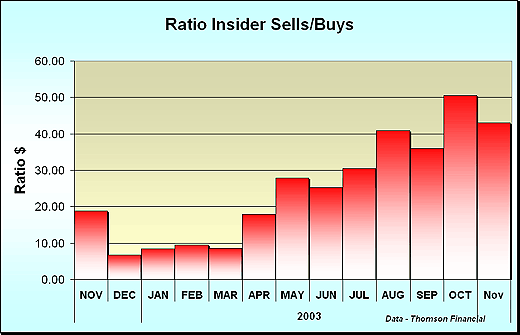
| In their latest advisory, Thomson Financial warned clients that insiders were continuing to take profits. Shares sales surged 43% in November to $4.5 billion versus $3.3 billion in October. This represents the highest level of insider selling since May 2001. However, the best measure of insider selling, the ratio of insider shares sold to shares purchased, dropped slightly from a high of $50.44 in October to $42.98 in November, a result of increased insider buying. Could this be an indication of some sort of market top in the making? |
| As discussed in "Insiders Continue to Unload" (http://technical.traders.com/tradersonline/display.asp?art=1384), insiders rely on share sales as a form of currency so increasing levels of selling do not necessarily portend a market reversal. But extreme levels must be taken seriously, especially if they are accompanied by other negative signals. |

|
| Figure 1 – Ratio of insider shares sold to share purchased. Data provided by Thomson Financial. |
| |
| In his daily MurphyMorris Market Message on December 9, John Murphy showed a daily chart of Intel (INTC) with double tops at around $34.50 and a $32 neckline that was decisively broken during the day on increasing volume. It also penetrated its 50-day moving average. The Semiconductor Index (SOX), of which Intel is a bellwether, broke down as well. As Murphy commented in the report, this factor played a big part in the selling that took place in the Nasdaq and this breakdown is "not good for either one." In his latest book, Intermarket Analysis, scheduled for release in early 2004, John discusses market cycles and sector rotation in extensive detail. There are two sure signs that a bull is slowing down. First, technology stocks falter and correct. The caboose in the rally train is coming down the track when energy stocks move into the lead. On December 9, that is exactly what happened. Murphy sums it all up in the final two sentences of his letter, "I had suggested last week that leadership by energy stocks is usually associated with some correction action in the rest of the stock market. That appears to be what we're getting." SUGGESTED READING: Murphy, John [2004], "Intermarket Analysis," John Wiley & Sons The MurphyMorris Market Message http://www.murphymorris.com or http://www.stockcharts.com |
Matt Blackman is a full-time technical and financial writer and trader. He produces corporate and financial newsletters, and assists clients in getting published in the mainstream media. He is the host of TradeSystemGuru.com. Matt has earned the Chartered Market Technician (CMT) designation. Find out what stocks and futures Matt is watching on Twitter at www.twitter.com/RatioTrade
| Company: | TradeSystemGuru.com |
| Address: | Box 2589 |
| Garibaldi Highlands, BC Canada | |
| Phone # for sales: | 604-898-9069 |
| Fax: | 604-898-9069 |
| Website: | www.tradesystemguru.com |
| E-mail address: | indextradermb@gmail.com |
Traders' Resource Links | |
| TradeSystemGuru.com has not added any product or service information to TRADERS' RESOURCE. | |
Click here for more information about our publications!
Comments
Date: 01/01/04Rank: 3Comment:

Request Information From Our Sponsors
- VectorVest, Inc.
- Executive Premier Workshop
- One-Day Options Course
- OptionsPro
- Retirement Income Workshop
- Sure-Fire Trading Systems (VectorVest, Inc.)
- Trading as a Business Workshop
- VectorVest 7 EOD
- VectorVest 7 RealTime/IntraDay
- VectorVest AutoTester
- VectorVest Educational Services
- VectorVest OnLine
- VectorVest Options Analyzer
- VectorVest ProGraphics v6.0
- VectorVest ProTrader 7
- VectorVest RealTime Derby Tool
- VectorVest Simulator
- VectorVest Variator
- VectorVest Watchdog
- StockCharts.com, Inc.
- Candle Patterns
- Candlestick Charting Explained
- Intermarket Technical Analysis
- John Murphy on Chart Analysis
- John Murphy's Chart Pattern Recognition
- John Murphy's Market Message
- MurphyExplainsMarketAnalysis-Intermarket Analysis
- MurphyExplainsMarketAnalysis-Visual Analysis
- StockCharts.com
- Technical Analysis of the Financial Markets
- The Visual Investor
