

HOT TOPICS LIST
- MACD
- Fibonacci
- RSI
- Gann
- ADXR
- Stochastics
- Volume
- Triangles
- Futures
- Cycles
- Volatility
- ZIGZAG
- MESA
- Retracement
- Aroon
INDICATORS LIST
LIST OF TOPICS
PRINT THIS ARTICLE
by Gary Grosschadl
Canada's builder of planes, trains and recreational products is in the throes of completing a classic pattern - a head and shoulders top.
Position: Sell
Gary Grosschadl
Independent Canadian equities trader and technical analyst based in Peterborough
Ontario, Canada.
PRINT THIS ARTICLE
HEAD & SHOULDERS
Bombardier Gives Another Shorting Opportunity
12/11/03 10:18:26 AMby Gary Grosschadl
Canada's builder of planes, trains and recreational products is in the throes of completing a classic pattern - a head and shoulders top.
Position: Sell
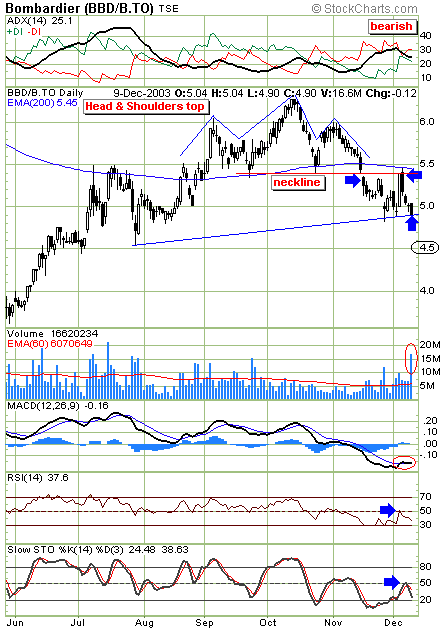
| In my previous article about Bombardier (07/11/03) I showed a buy situation with various upside targets, one of which was a pitchfork median line target of $6.30. The interim target of 5.50 was hit as shown on the left of this chart. Approximately three months later that upside median line target was hit at around 6.30. That top has turned out to be a head and shoulders formation as this chart illustrates. |
| Quite often a head and shoulders formation presents two good opportunities to enter a short position -- At the neckline failure and then again at a retest of that same neckline as the bulls attempt to move the stock back up. Here is a third opportunity (the third blue arrow) as the stock tests a lower trendline on exceptional volume. Traders today placed their bets on this line not holding via this volume spike. The downside target for this head and shoulders pattern actually lies at $4.50 by the measure of the top to the troughline as applied below the troughline. Shorters here probably have that target in mind. This does not mean that a very bearish decline will halt there but a bounce of some kind is likely should that level be reached. |
|
| Bombardier's daily chart showing a classic head and shoulders topping pattern. |
| Graphic provided by: Stockcharts.com. |
| |
| Various indicators also reflect the bearish state of things. The directional movement indicator at the top of the chart shows the bears in control with the ADX line in between the DI lines with -DI on top. The MACD (moving average convergence/divergence) shows the MACD line stalling at its thinner signal line crossover attempt. The remaining two indicators both show a stall at the often crucial 50 level and their subsequent downturns. |
Independent Canadian equities trader and technical analyst based in Peterborough
Ontario, Canada.
| Website: | www.whatsonsale.ca/financial.html |
| E-mail address: | gwg7@sympatico.ca |
Click here for more information about our publications!
PRINT THIS ARTICLE

Request Information From Our Sponsors
- StockCharts.com, Inc.
- Candle Patterns
- Candlestick Charting Explained
- Intermarket Technical Analysis
- John Murphy on Chart Analysis
- John Murphy's Chart Pattern Recognition
- John Murphy's Market Message
- MurphyExplainsMarketAnalysis-Intermarket Analysis
- MurphyExplainsMarketAnalysis-Visual Analysis
- StockCharts.com
- Technical Analysis of the Financial Markets
- The Visual Investor
- VectorVest, Inc.
- Executive Premier Workshop
- One-Day Options Course
- OptionsPro
- Retirement Income Workshop
- Sure-Fire Trading Systems (VectorVest, Inc.)
- Trading as a Business Workshop
- VectorVest 7 EOD
- VectorVest 7 RealTime/IntraDay
- VectorVest AutoTester
- VectorVest Educational Services
- VectorVest OnLine
- VectorVest Options Analyzer
- VectorVest ProGraphics v6.0
- VectorVest ProTrader 7
- VectorVest RealTime Derby Tool
- VectorVest Simulator
- VectorVest Variator
- VectorVest Watchdog