HOT TOPICS LIST
- MACD
- Fibonacci
- RSI
- Gann
- ADXR
- Stochastics
- Volume
- Triangles
- Futures
- Cycles
- Volatility
- ZIGZAG
- MESA
- Retracement
- Aroon
INDICATORS LIST
LIST OF TOPICS
PRINT THIS ARTICLE
by Koos van der Merwe
There are many ways to use Gann fans to identify turnings points for a stock. This article shows how to use the fan progressively.
Position: Hold
Koos van der Merwe
Has been a technical analyst since 1969, and has worked as a futures and options trader with First Financial Futures in Johannesburg, South Africa.
PRINT THIS ARTICLE
GANN
Part III: Lessons In Gann
12/08/03 12:53:59 PMby Koos van der Merwe
There are many ways to use Gann fans to identify turnings points for a stock. This article shows how to use the fan progressively.
Position: Hold
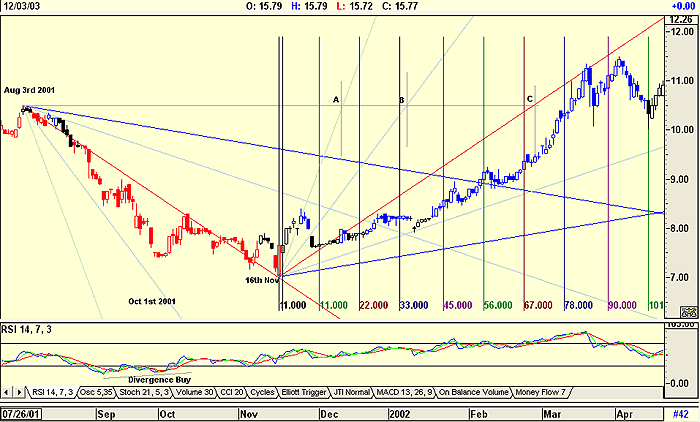
| Again, I'm using the same chart of Advantage Energy (AVN.UN-T) that I used in Parts I and II. But this time I'm zeroing in on only a section of the chart. Looking at the first figure, note the following: 1. The Gann fan down is drawn from the high of August 3rd. The 1 x 1 is 0.05 and did not intersect the suggested turning point of October 1st, but intersected the low on November 16. 2. From this low I drew the Gann fan upwards with the 1 x 1 at 0.05, the same size as before. I have also drawn a horizontal line from the start of the down fan on August 3rd, and have marked where the fan lines cross the horizontal line at points A, B and C. These are points in time where you can expect minor corrections to the trend. As you can see, in all instances they were pretty accurate, and if off, it was usually by no more than a day. |
| 3. I have also drawn Gann numbers from the November 16 low. To explain, Gann believed that trading occurred in different times around the world, so he envisioned a circle of 360 degrees. He then divided the circle into 180, 90, 45, then 22 (not 22.5), and 11. He believed these were possible turning points. I have drawn them in on the chart, and there were indeed corrections at those points. The numbers he regarded as especially significant were 45, 90, and 180. He regarded the time between 101 and 112 as the "Death Zone," meaning that if the share indeed corrected at 90, it would fall to a low possibly between 101 to 112. In the chart shown, the share topped three days after the 90, and hit a low at 101. 4. Putting the two suggested techniques, namely 2 and 3 together, you have a pretty good idea of what to expect as far as forecasting possible turning points. |

|
| Gann fan and Gann numbers. |
| Graphic provided by: AdvancedGET. |
| |
| 5. With Gann's interest in astronomy and the influence of the planets on man's emotions, he would also have included the solstice turning points in the chart. But I have left them out as the chart would once again become too busy. |
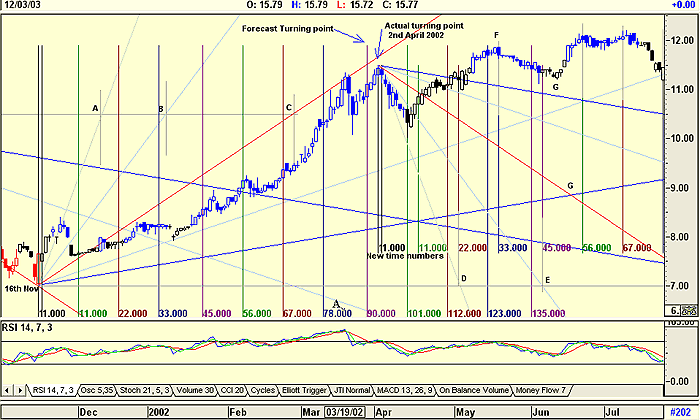
 In the second chart I have moved the time forward so you can see the actual turning point and the forecasted turning point. Note the following: 1. I have drawn a down fan with the 1 x 1 as 0.05. This is debatable. Many Gann analysts believe that this number can be changed to meet the chart. As a purist, I prefer to try and keep all my angles equal to the first one. 2. I have started a new set of time numbers from the high of April 2, 2002. The numbers do not quite match the first set of time numbers drawn from the previous low, but they do correlate exactly with D and E, points on the horizontal line drawn from the November 16 low that are crossed by the Gann fan. The time zones 123 and 33 have called a reversal at F, but the low at G was better called by the crossover of two Gann fan lines that the time number, 45. The numbers 56 and 67 are however right on. |
| I have only presented a taste of what Gann theory offers in these three articles, and yes, I do use them in my long-term forecasts, and like to add Elliott wave analysis to the charts I prepare. Are they self-fulfilling? Probably, but don't forget I accept the astronomy side of Gann, and follow Bradley charts as a confirmation to suggested Gann fan turning points. Have I been accurate in my forecasts? Yes and no. I am human and do have emotions, and when my charts called the 2000 top, I found great difficulty in believing them with all the hype in the media about the "new economy." Take what you like from my experiences and have fun. |
Has been a technical analyst since 1969, and has worked as a futures and options trader with First Financial Futures in Johannesburg, South Africa.
| Address: | 3256 West 24th Ave |
| Vancouver, BC | |
| Phone # for sales: | 6042634214 |
| E-mail address: | petroosp@gmail.com |
Click here for more information about our publications!
Comments

|

Request Information From Our Sponsors
- StockCharts.com, Inc.
- Candle Patterns
- Candlestick Charting Explained
- Intermarket Technical Analysis
- John Murphy on Chart Analysis
- John Murphy's Chart Pattern Recognition
- John Murphy's Market Message
- MurphyExplainsMarketAnalysis-Intermarket Analysis
- MurphyExplainsMarketAnalysis-Visual Analysis
- StockCharts.com
- Technical Analysis of the Financial Markets
- The Visual Investor
- VectorVest, Inc.
- Executive Premier Workshop
- One-Day Options Course
- OptionsPro
- Retirement Income Workshop
- Sure-Fire Trading Systems (VectorVest, Inc.)
- Trading as a Business Workshop
- VectorVest 7 EOD
- VectorVest 7 RealTime/IntraDay
- VectorVest AutoTester
- VectorVest Educational Services
- VectorVest OnLine
- VectorVest Options Analyzer
- VectorVest ProGraphics v6.0
- VectorVest ProTrader 7
- VectorVest RealTime Derby Tool
- VectorVest Simulator
- VectorVest Variator
- VectorVest Watchdog
