HOT TOPICS LIST
- MACD
- Fibonacci
- RSI
- Gann
- ADXR
- Stochastics
- Volume
- Triangles
- Futures
- Cycles
- Volatility
- ZIGZAG
- MESA
- Retracement
- Aroon
INDICATORS LIST
LIST OF TOPICS
PRINT THIS ARTICLE
by Gary Grosschadl
On December 3rd the Nasdaq touched 2000 for the first time in nearly two years. But instead of a bullish milestone, a poor close and warnings from several indicators spell the beginning of a likely downleg.
Position: Sell
Gary Grosschadl
Independent Canadian equities trader and technical analyst based in Peterborough
Ontario, Canada.
PRINT THIS ARTICLE
DOUBLE TOPS
Nasdaq Double Top Threat
12/05/03 10:33:21 AMby Gary Grosschadl
On December 3rd the Nasdaq touched 2000 for the first time in nearly two years. But instead of a bullish milestone, a poor close and warnings from several indicators spell the beginning of a likely downleg.
Position: Sell
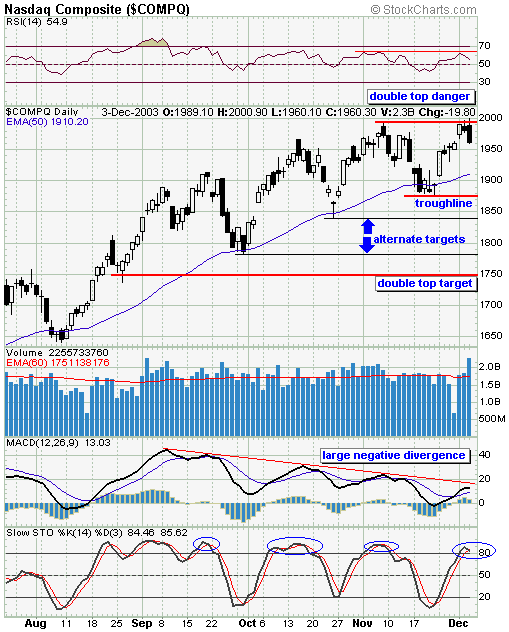
| As the Nasdaq has been steadily rising, bearish negative divergences have threatened, but all recent retracements have been saved by the 50-day EMA. Now a recognizable topping pattern is in sight so this next downleg likely has more significance. |
| This daily chart shows a possible double top developing. Should a downleg breach the troughline located noticeably below the 50-day EMA line, then the double top pattern may fulfill to the downside target. Can the same moving average line save the Nasdaq once again? Perhaps but the odds are getting worse each time. The negative divergences on the RSI (relative strength index) and the MACD (moving average convergence/divergence) will not go on forever without exacting a price down the road, and the time may be near. |

|
| Daily chart of the Nasdaq showing downside possibilites. |
| Graphic provided by: Stockcharts.com. |
| |
| The stochastics indicator shows an overbought condition similar to the past few occasions that led to sizeable retracements. A move below the 80 level may occur on December 4th, with bearish follow through. This downleg should at least bring the index down to a troughline test as marked unless the 50-day EMA holds once again. The MACD looks particularily ominous because the downtrend is much nearer the zero line, hinting at a stronger possibility of both the MACD and its signal line crossing below it. A move below this zero line that is not immediately rebuffed, is another bearish signal, the others being negative divergence relative to the index's rising trend, and the crossover of the MACD line through its thinner signal line. Further bearish action on the Nasdaq will lead to this crossover and then the zero line crossover comes into bearish range. |
| The chart shows four downside targets below the 50-day EMA, depending on the severity of a downleg. These are the double top troughline at 1875, the previous retracement mark of 1840, the prior retracement mark of 1780, and finally the measured double top retracement of 1750. This measurement is the distance from the double top to the troughline being applied below the troughline. |
| So, in summary, unless there is a surprise reversal in the next trading session, a downleg is very likely in effect. Whether it becomes a full blown double top breakdown or a retracement to one of the alternate targets, only time will tell. |
Independent Canadian equities trader and technical analyst based in Peterborough
Ontario, Canada.
| Website: | www.whatsonsale.ca/financial.html |
| E-mail address: | gwg7@sympatico.ca |
Click here for more information about our publications!
Comments

Request Information From Our Sponsors
- StockCharts.com, Inc.
- Candle Patterns
- Candlestick Charting Explained
- Intermarket Technical Analysis
- John Murphy on Chart Analysis
- John Murphy's Chart Pattern Recognition
- John Murphy's Market Message
- MurphyExplainsMarketAnalysis-Intermarket Analysis
- MurphyExplainsMarketAnalysis-Visual Analysis
- StockCharts.com
- Technical Analysis of the Financial Markets
- The Visual Investor
- VectorVest, Inc.
- Executive Premier Workshop
- One-Day Options Course
- OptionsPro
- Retirement Income Workshop
- Sure-Fire Trading Systems (VectorVest, Inc.)
- Trading as a Business Workshop
- VectorVest 7 EOD
- VectorVest 7 RealTime/IntraDay
- VectorVest AutoTester
- VectorVest Educational Services
- VectorVest OnLine
- VectorVest Options Analyzer
- VectorVest ProGraphics v6.0
- VectorVest ProTrader 7
- VectorVest RealTime Derby Tool
- VectorVest Simulator
- VectorVest Variator
- VectorVest Watchdog
