HOT TOPICS LIST
- MACD
- Fibonacci
- RSI
- Gann
- ADXR
- Stochastics
- Volume
- Triangles
- Futures
- Cycles
- Volatility
- ZIGZAG
- MESA
- Retracement
- Aroon
INDICATORS LIST
LIST OF TOPICS
PRINT THIS ARTICLE
by Kevin Hopson
Natural gas looks to have put in a significant bottom, as October's falling wedge breakout has held up thus far.
Position: Hold
Kevin Hopson
Kevin has been a technical analyst for roughly 10 years now. Previously, Kevin owned his own business and acted as a registered investment advisor, specializing in energy. He was also a freelance oil analyst for Orient Trading Co., a commodity futures trading firm in Japan. Kevin is currently a freelance writer.
PRINT THIS ARTICLE
WEDGE FORMATIONS
Things Are Looking Up For Natural Gas
12/04/03 11:51:52 AMby Kevin Hopson
Natural gas looks to have put in a significant bottom, as October's falling wedge breakout has held up thus far.
Position: Hold
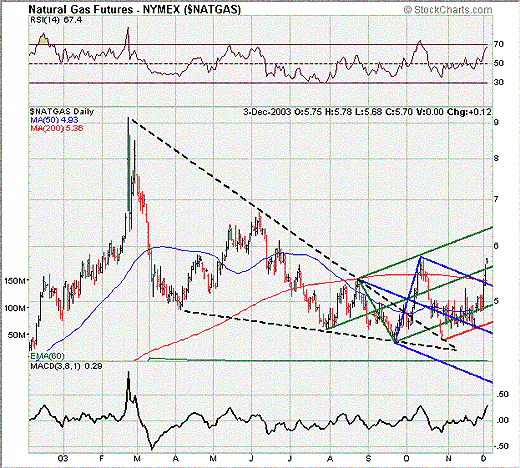
| The last time I touched on natural gas was in early October when prices proceeded to break out of a large falling wedge formation. This is illustrated by the dotted black lines in the one-year chart. At the time, I said that natural gas prices had likely seen a significant bottom, the reason being that large triangle formations, such as falling wedges, tend to occur at market bottoms. Since prices broke to the upside from this formation (reversing the seven-month downtrend in the process), I felt confident that such a bottom had occurred. |
| However, the sharp pullback quickly thereafter had me second guessing myself a little bit. Fortunately, prices bounced off February's downtrend line (top of the prior wedge formation), holding above September's low in the process. In other words, the prior low was still intact. Just to note, prices often find support around former resistance levels, which - in this case - was February's downtrend line. As a result, the technicals stayed true to form. |

|
| Graphic provided by: Stockcharts.com. |
| |
| You will notice, however, that prices broke the bottom parallel line of the green pitchfork while returning to the top of the wedge formation. This is usually a bearish sign but in order to give prices a second chance, I drew a new trendline, as illustrated by the sliding red parallel line. If prices had breached this new trendline, it would have been a clear signal to sell. As you can see though, prices bounced off this trendline and continued to move higher. |
| Since then, prices have overcome the 50-day ($4.93) and 200-day ($5.36) moving averages, as well as the top blue parallel line and the green median line. Though many of the indicators are reaching overbought levels, the longer-term picture still looks bullish. For example, if September's low was in fact a significant bottom, natural gas is likely in the third wave of a new uptrend. If so, prices should eventually move above the October high. Assuming this occurs, a couple of potential price targets are the 38.2 percent retracement level from the Feb.-Sept. decline ($6.20) and the top green parallel line ($6.40). |
Kevin has been a technical analyst for roughly 10 years now. Previously, Kevin owned his own business and acted as a registered investment advisor, specializing in energy. He was also a freelance oil analyst for Orient Trading Co., a commodity futures trading firm in Japan. Kevin is currently a freelance writer.
| Glen Allen, VA | |
| E-mail address: | hopson_1@yahoo.com |
Click here for more information about our publications!
Comments
Date: 12/06/03Rank: 5Comment:

Request Information From Our Sponsors
- StockCharts.com, Inc.
- Candle Patterns
- Candlestick Charting Explained
- Intermarket Technical Analysis
- John Murphy on Chart Analysis
- John Murphy's Chart Pattern Recognition
- John Murphy's Market Message
- MurphyExplainsMarketAnalysis-Intermarket Analysis
- MurphyExplainsMarketAnalysis-Visual Analysis
- StockCharts.com
- Technical Analysis of the Financial Markets
- The Visual Investor
- VectorVest, Inc.
- Executive Premier Workshop
- One-Day Options Course
- OptionsPro
- Retirement Income Workshop
- Sure-Fire Trading Systems (VectorVest, Inc.)
- Trading as a Business Workshop
- VectorVest 7 EOD
- VectorVest 7 RealTime/IntraDay
- VectorVest AutoTester
- VectorVest Educational Services
- VectorVest OnLine
- VectorVest Options Analyzer
- VectorVest ProGraphics v6.0
- VectorVest ProTrader 7
- VectorVest RealTime Derby Tool
- VectorVest Simulator
- VectorVest Variator
- VectorVest Watchdog
