HOT TOPICS LIST
- MACD
- Fibonacci
- RSI
- Gann
- ADXR
- Stochastics
- Volume
- Triangles
- Futures
- Cycles
- Volatility
- ZIGZAG
- MESA
- Retracement
- Aroon
INDICATORS LIST
LIST OF TOPICS
PRINT THIS ARTICLE
by David Penn
The Dow Transports need to take out their November highs or this bull market will be in trouble in the near term.
Position: N/A
David Penn
Technical Writer for Technical Analysis of STOCKS & COMMODITIES magazine, Working-Money.com, and Traders.com Advantage.
PRINT THIS ARTICLE
DOW THEORY
Dow 3,000
12/04/03 08:42:24 AMby David Penn
The Dow Transports need to take out their November highs or this bull market will be in trouble in the near term.
Position: N/A
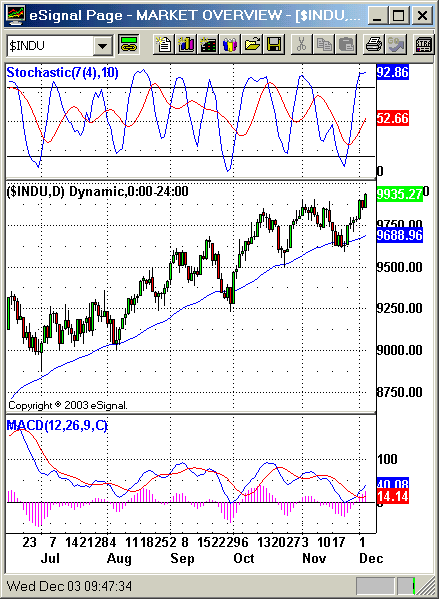
| The Industrials and Transports have matched high-for-high and low-for-low since both broke out in August. In some ways, it is as clear-cut a vindication of Dow theory as any trader is likely to see. While there is certainly more to Dow theory than the maxim that "the averages must confirm," this particular tenet of Dow theory rightly receives a great deal of attention from those trying to determine the staying power of a market advance. |
| Look at how the Industrials and Transports have traded. On August 22nd both averages recorded monthly highs. After correcting from these highs, both averages put in a bottom on the same day, August 26th. The subsequent rally going into September saw both the Industrials and the Transports making monthly highs within one day of each other (September 18th for the Transports, September 19th for the Industrials). The correction from these highs resulted in bottoms that were also only one day apart (September 29th for the Transports, September 30th for the Industrials). |

|
| Figure 1: The Dow Industrials take out the November highs early in December. |
| Graphic provided by: eSignal. |
| |
| Together, they continued to make higher highs and higher lows. Both averages established their October highs one day apart -- this time with the Industrials leading (October 15th compared to the 16th for the Transports). The short correction from the October highs? Once again, the averages were very much in gear with each other as they bottomed (again) only one day apart (October 23rd for the Transports, October 24th for the Industrials). In November, the pattern continued. Both averages hit their monthly high on the same date (November 7th) and, as prices retreated in a brief correction, both averages established a bottom on the same date (November 21st). |
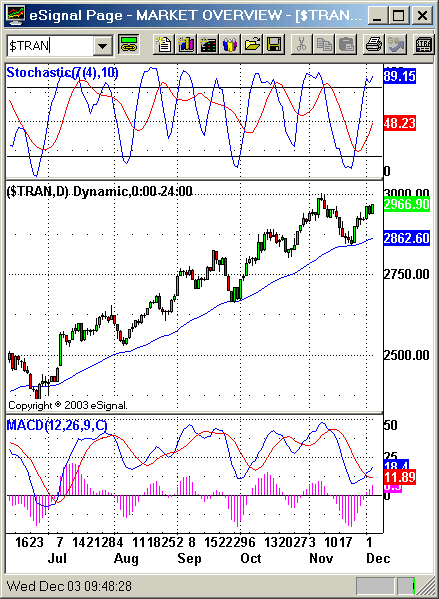
| Unfortunately for the bulls, this is where things have started to get a little dicey -- at least potentially. Since bottoming together on November 21st, the Industrials have gone ahead to set a higher high vis-a-vis the November highs, while the Transports have yet to do the same. While there is plenty of time for the Tranports to "catch up," the fact that these averages have been so "in gear" with each other for months does make this most recent development a little troubling. |
 Figure 2. A close above 3,000 in the Dow Transports is critical to a continued rally in the markets. It should be emphasized that both averages are very much in bull markets. Even though the Dow transports have yet to make a new high vis-a-vis November, that uptrend is still very much intact. The 50-day exponential moving average is still rising on the daily chart of the Dow Transports and, while the stochastic shows an overbought market, neither the MACD nor the MACD histogram are showing the Transports to be particularly overextended. Those who fear that the market has moved too far too fast since breaking out in August may add a lagging Dow Transportation average to their list of worries. But a solid close above 3,000 -- the level of the November highs -- would allow those same traders to exchange their caution for confidence. |
Technical Writer for Technical Analysis of STOCKS & COMMODITIES magazine, Working-Money.com, and Traders.com Advantage.
| Title: | Technical Writer |
| Company: | Technical Analysis, Inc. |
| Address: | 4757 California Avenue SW |
| Seattle, WA 98116 | |
| Phone # for sales: | 206 938 0570 |
| Fax: | 206 938 1307 |
| Website: | www.Traders.com |
| E-mail address: | DPenn@traders.com |
Traders' Resource Links | |
| Charting the Stock Market: The Wyckoff Method -- Books | |
| Working-Money.com -- Online Trading Services | |
| Traders.com Advantage -- Online Trading Services | |
| Technical Analysis of Stocks & Commodities -- Publications and Newsletters | |
| Working Money, at Working-Money.com -- Publications and Newsletters | |
| Traders.com Advantage -- Publications and Newsletters | |
| Professional Traders Starter Kit -- Software | |
Click here for more information about our publications!
Comments
Date: 12/06/03Rank: 5Comment:
Date: 12/17/03Rank: 4Comment:

|

Request Information From Our Sponsors
- StockCharts.com, Inc.
- Candle Patterns
- Candlestick Charting Explained
- Intermarket Technical Analysis
- John Murphy on Chart Analysis
- John Murphy's Chart Pattern Recognition
- John Murphy's Market Message
- MurphyExplainsMarketAnalysis-Intermarket Analysis
- MurphyExplainsMarketAnalysis-Visual Analysis
- StockCharts.com
- Technical Analysis of the Financial Markets
- The Visual Investor
- VectorVest, Inc.
- Executive Premier Workshop
- One-Day Options Course
- OptionsPro
- Retirement Income Workshop
- Sure-Fire Trading Systems (VectorVest, Inc.)
- Trading as a Business Workshop
- VectorVest 7 EOD
- VectorVest 7 RealTime/IntraDay
- VectorVest AutoTester
- VectorVest Educational Services
- VectorVest OnLine
- VectorVest Options Analyzer
- VectorVest ProGraphics v6.0
- VectorVest ProTrader 7
- VectorVest RealTime Derby Tool
- VectorVest Simulator
- VectorVest Variator
- VectorVest Watchdog
