HOT TOPICS LIST
- MACD
- Fibonacci
- RSI
- Gann
- ADXR
- Stochastics
- Volume
- Triangles
- Futures
- Cycles
- Volatility
- ZIGZAG
- MESA
- Retracement
- Aroon
INDICATORS LIST
LIST OF TOPICS
PRINT THIS ARTICLE
by Koos van der Merwe
On December 3, 2003, I presented a report showing the first of three methods using Gann fans to trade. All are part of WD Gann's arsenal. Plotting them on a single chart would make the page so busy that it would discourage traders from using Gann fans. So I have separated them into three studies. Here is my second method.
Position: Accumulate
Koos van der Merwe
Has been a technical analyst since 1969, and has worked as a futures and options trader with First Financial Futures in Johannesburg, South Africa.
PRINT THIS ARTICLE
GANN
Part II: Lessons In Gann
12/05/03 10:31:18 AMby Koos van der Merwe
On December 3, 2003, I presented a report showing the first of three methods using Gann fans to trade. All are part of WD Gann's arsenal. Plotting them on a single chart would make the page so busy that it would discourage traders from using Gann fans. So I have separated them into three studies. Here is my second method.
Position: Accumulate
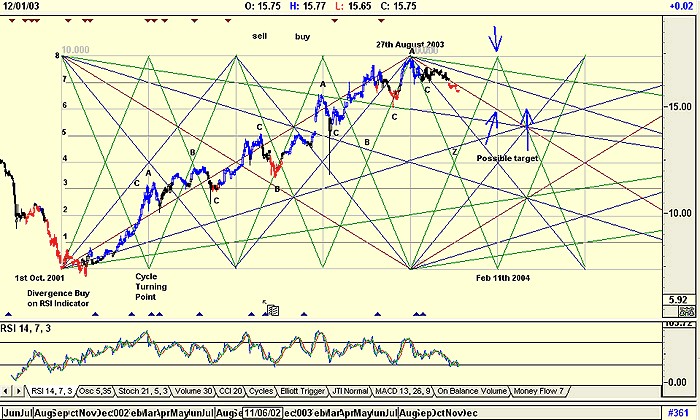
| I am using the same stock I presented in the first study. This time however, instead of drawing a simple Gann fan with 1 x 1 parallel lines drawn from highs and lows as buy and sell ranges, I have drawn the original Gann square and divided the trading range into eighths as Gann would have done. |
| A look at the chart shows the following. 1. The 1 x 1 drawn from October 1, 2001 is a multiple of 1. 2. A fan down is drawn from a point above the October 1st parallel with the high of August 27, 2003. 3. The Gann fan down has been drawn from the high of August 27th, with a Gann fan drawn in space parallel to the low of October 1, 2001. 4. At "A" the chart reversed when the 1 x 4 or 4 x 1 intersected the horizontal drawn from the chart low marked "10" and high, marked "8." 5. At "B" the 1 x 4 and 4 x 1s crossed and the chart corrected. 6. At "C" the price found support or resistance at one of the horizontal eighths lines. |

|
| Gann squares. |
| Graphic provided by: AdvancedGET. |
| |
| What does this mean for the future? 1. Remember that downtrends usually fall twice as fast as uptrends. This chart is no exception and the price followed the 4 x 1 angle down until it hit the horizontal "17" when it moved sideways, eventually breaking through. 2. The share tested and then broke below line "17." This means that it could find support at line "6" at $14.88. 3. A time reversal could be February 11, 2004, which is where the 4 x 1 and 1 x 4 intersect the "10" and "18" horizontals of the "square." 4. Another correction could be occurring now because of the crossover of the 1 x 4 and 4 x 1 lines at "Z." This does appear very likely because of the oversold position of the RSI indicator. 5. Minor turning points could occur where other angles intersect, but I have tried to keep my analysis simple. However I am always aware of them. |
| Admittedly this is a very busy chart. I have applied the analysis to a share rather than an index, as I did not want to present a forecast of the market. I must admit that in the past, I have been successful at calling long-term turning points using this method of analysis. For short-term analyses using Gann fans I prefer using the technique that I will demonstrate in my next article. |
Has been a technical analyst since 1969, and has worked as a futures and options trader with First Financial Futures in Johannesburg, South Africa.
| Address: | 3256 West 24th Ave |
| Vancouver, BC | |
| Phone # for sales: | 6042634214 |
| E-mail address: | petroosp@gmail.com |
Click here for more information about our publications!
PRINT THIS ARTICLE

Request Information From Our Sponsors
- StockCharts.com, Inc.
- Candle Patterns
- Candlestick Charting Explained
- Intermarket Technical Analysis
- John Murphy on Chart Analysis
- John Murphy's Chart Pattern Recognition
- John Murphy's Market Message
- MurphyExplainsMarketAnalysis-Intermarket Analysis
- MurphyExplainsMarketAnalysis-Visual Analysis
- StockCharts.com
- Technical Analysis of the Financial Markets
- The Visual Investor
- VectorVest, Inc.
- Executive Premier Workshop
- One-Day Options Course
- OptionsPro
- Retirement Income Workshop
- Sure-Fire Trading Systems (VectorVest, Inc.)
- Trading as a Business Workshop
- VectorVest 7 EOD
- VectorVest 7 RealTime/IntraDay
- VectorVest AutoTester
- VectorVest Educational Services
- VectorVest OnLine
- VectorVest Options Analyzer
- VectorVest ProGraphics v6.0
- VectorVest ProTrader 7
- VectorVest RealTime Derby Tool
- VectorVest Simulator
- VectorVest Variator
- VectorVest Watchdog
