

HOT TOPICS LIST
- MACD
- Fibonacci
- RSI
- Gann
- ADXR
- Stochastics
- Volume
- Triangles
- Futures
- Cycles
- Volatility
- ZIGZAG
- MESA
- Retracement
- Aroon
INDICATORS LIST
LIST OF TOPICS
PRINT THIS ARTICLE
by David Penn
A diamond pattern that developed in yen futures suggests higher prices for the Japanese currency in the near term.
Position: N/A
David Penn
Technical Writer for Technical Analysis of STOCKS & COMMODITIES magazine, Working-Money.com, and Traders.com Advantage.
PRINT THIS ARTICLE
THE DIAMOND
A Diamond In The Yen
12/04/03 11:49:02 AMby David Penn
A diamond pattern that developed in yen futures suggests higher prices for the Japanese currency in the near term.
Position: N/A
| Before I go any further, let me acknowledge that the diamond pattern I am referring to is not perfect. It may have only one flaw -- the lack of a significant high in the middle of the pattern to make up the top point of the diamond -- but this flaw is worth noting now, whether or not the pattern ends up working as a picture-perfect diamond formation. |
| Chart patterns are not hieroglyphics. What they represent is the grouping together of like price action that has tended to produce the same sort of outcome. This is why even imperfect chart patterns -- different from failed chart patterns -- can still be as helpful as so-called perfect ones. After all, a head and shoulders top is, at root, a high, a higher high, a failure to take out the previous high, and a subsequent drop through the intra-peak / intra-high lows. Often, higher volume accompanies the left side of the formation. How artistic need a head and shoulders top be -- as long as it meets these minimum requirements? Is an "imperfect" flag in a bear market any less an opportunity to enter the market on the short side than a "perfect" flag? |
|
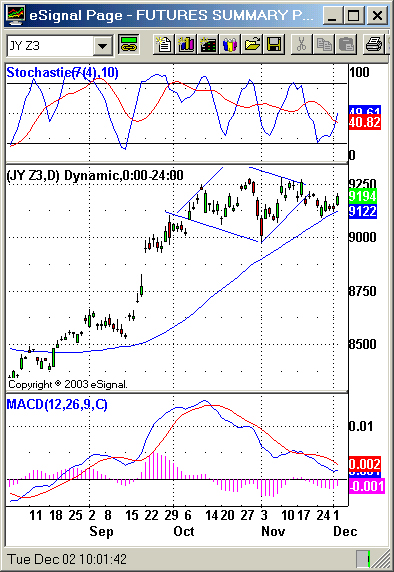
| After dropping to support at its 50-day EMA, prices for the December yen look likely to rally to new highs. |
| Graphic provided by: eSignal. |
| |
| That said, consider the imperfect diamond in December yen futures. One of the things that stands out with this diamond is the way that it appears initially to have broken out on the downside. Although prices have not fallen below the low of the formation (at about 9000), they have not rallied above the breakout point (closer to 9250) either. While this could be cause to reject the formation altogether (breakouts that move sideways tend not to be true breakouts), there are a few factors that suggest that some directional movement might actually develop in the December yen sooner than later. |
| One of these factors is the rising 50-day exponential moving average, which has been in a particularly bullish mode since early September. The break from the diamond did move down, but it has so far found support on the 50-day moving average. Should this support hold, then prices will be almost squeezed up to the original breakout point and, potentially, even higher. Another factor in favor of higher December yen prices is the rising-from-oversold stochastic. The stochastic oscillator (which is set to 7 %K and 10 %D) has not been this oversold since early September, right before the December yen futures soared from approximately 8537 to 8949 in six trading days. While the oscillator could certainly turn back down, any continued movement upward in the near term should be supportive of higher prices. |
| A last factor is the MACD histogram. Many observers (including Dr. Alexander Elder, who has championed the MACD and the MACD histogram in his books Trading for a Living and Come Into My Trading Room) have cautioned against reliance on the MACD histogram when it comes to daily charts. Nevertheless, looking for peaks and trough lows in the MACD histogram can be an effective way toward anticipating swings in price action. Here, the MACD histogram began moving down on November 20th, reaching a low on the 25th that remains as of this writing. Should the MACD histogram tick higher and mark a shallower low, then it would be yet another sign that the market's swing to the downside was likely over and a move back toward a resumption of the trend was coming. Should the December yen move back up -- thus forming a bullish breakout after a short fake to the downside -- what sort of upside might be expected? Given the formation size of the diamond of about 300 and a breakout level of approximately 9195, a minimum upside of 9495 should be expected over the next month or so. |
Technical Writer for Technical Analysis of STOCKS & COMMODITIES magazine, Working-Money.com, and Traders.com Advantage.
| Title: | Technical Writer |
| Company: | Technical Analysis, Inc. |
| Address: | 4757 California Avenue SW |
| Seattle, WA 98116 | |
| Phone # for sales: | 206 938 0570 |
| Fax: | 206 938 1307 |
| Website: | www.Traders.com |
| E-mail address: | DPenn@traders.com |
Traders' Resource Links | |
| Charting the Stock Market: The Wyckoff Method -- Books | |
| Working-Money.com -- Online Trading Services | |
| Traders.com Advantage -- Online Trading Services | |
| Technical Analysis of Stocks & Commodities -- Publications and Newsletters | |
| Working Money, at Working-Money.com -- Publications and Newsletters | |
| Traders.com Advantage -- Publications and Newsletters | |
| Professional Traders Starter Kit -- Software | |
Click here for more information about our publications!
Comments

Request Information From Our Sponsors
- VectorVest, Inc.
- Executive Premier Workshop
- One-Day Options Course
- OptionsPro
- Retirement Income Workshop
- Sure-Fire Trading Systems (VectorVest, Inc.)
- Trading as a Business Workshop
- VectorVest 7 EOD
- VectorVest 7 RealTime/IntraDay
- VectorVest AutoTester
- VectorVest Educational Services
- VectorVest OnLine
- VectorVest Options Analyzer
- VectorVest ProGraphics v6.0
- VectorVest ProTrader 7
- VectorVest RealTime Derby Tool
- VectorVest Simulator
- VectorVest Variator
- VectorVest Watchdog
- StockCharts.com, Inc.
- Candle Patterns
- Candlestick Charting Explained
- Intermarket Technical Analysis
- John Murphy on Chart Analysis
- John Murphy's Chart Pattern Recognition
- John Murphy's Market Message
- MurphyExplainsMarketAnalysis-Intermarket Analysis
- MurphyExplainsMarketAnalysis-Visual Analysis
- StockCharts.com
- Technical Analysis of the Financial Markets
- The Visual Investor