HOT TOPICS LIST
- MACD
- Fibonacci
- RSI
- Gann
- ADXR
- Stochastics
- Volume
- Triangles
- Futures
- Cycles
- Volatility
- ZIGZAG
- MESA
- Retracement
- Aroon
INDICATORS LIST
LIST OF TOPICS
PRINT THIS ARTICLE
by David Penn
As the Philly Defense stocks index rallies to new 52-week highs, a number of defense stocks--including the much-beleagured Boeing--look poised to bounce.
Position: N/A
David Penn
Technical Writer for Technical Analysis of STOCKS & COMMODITIES magazine, Working-Money.com, and Traders.com Advantage.
PRINT THIS ARTICLE
RETRACEMENT
Defense Stocks On The Offensive
12/02/03 10:06:37 AMby David Penn
As the Philly Defense stocks index rallies to new 52-week highs, a number of defense stocks--including the much-beleagured Boeing--look poised to bounce.
Position: N/A
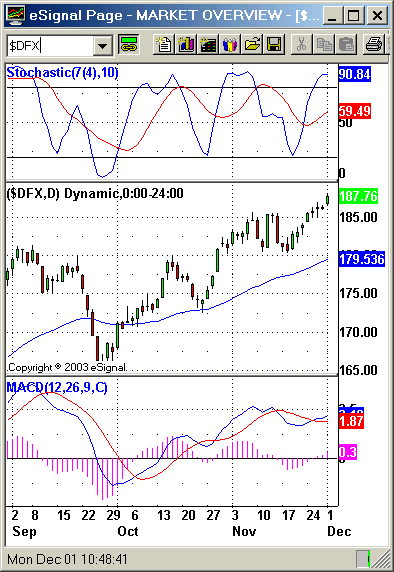
| One of the items of conventional market wisdom in the War on Terror/War on Iraq era was that defense stocks would outperform the market. This wisdom was based largely on common sense; if the U.S. is spending huge sums on defense, then the beneficiaries of this largess are likely to be the defense companies that make the weapons, guidance systems, electronics, etc. that the federal government is buying. After all, as the Austrian economists remind us, economics is about production, not consumption. And if the Pentagon is looking to consume defense goods, then somebody's gotta make 'em. A look at the Philadelphia Defense stocks index ($DFX), underscores much of the reason for bullishness in this sector -- at least in 2003. $DFX trended down for much of 2002 going into 2003, and bottomed along with much of the broader market in March 2003. Since that time, $DFX has rallied from a March low of 125.90 to a recent high just north of 188, an advance of some 49%. |
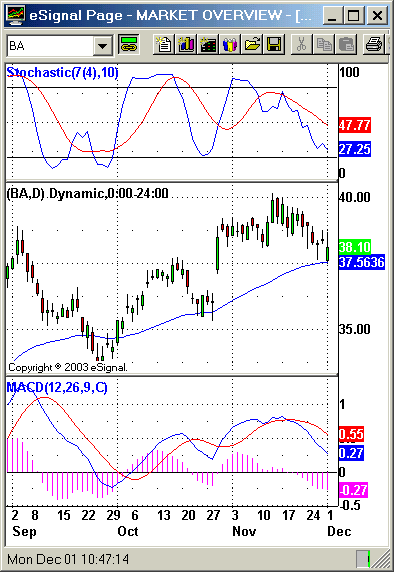
| Unfortunately, while the $DFX is making new highs ("new" in terms of the past 52 weeks), many of the leading defense stocks have yet to do so. Boeing (BA) for example appeared ready to take out its August high in mid-November, but pulled away and retreated to its 50-day EMA as the month ended. Other headline defense stocks have performed even worse: LLL (LLL)'s attempts to take out its late August high was even more pathetic than Boeing's attempt, and Northrup Grumman (NOC) has pretty much chopped into a ten point range for months. But there may be some reason to turn attention to these stocks, a few of which actually appear to be putting into place short-term bottoms from which new attempts to take out previous highs might be expected. Consider again Boeing. The newspapers have been filled with announcements of hiring scandals and the departure of three top executives -- including the company's CEO and chairman. Many people can't recall the last time Boeing won a contract over rival Airbus. . . |

|
| Figure 1: Defense stocks rallied strongly from deeply oversold conditions near the end of September. |
| Graphic provided by: eSignal. |
| |
| Nevertheless, Boeing's movement vis-a-vis its 50-day EMA remains bullish. Each time the stock has moved below its 50-day EMA since July and become oversold based on both the stochastic oscillator and the MACD, the stock has bounced back with great strength. The bounces in September and October were particularly noteworthy. And price action in early December appears to be setting up for the opportunity for another bounce and move to the upside. What are the reasons for being bullish on Boeing? There are a few things those who have been looking to buy Boeing on a pullback might want to consider. The 50-day EMA mentioned above is perhaps the first. The 50-day EMA has been effective support for Boeing since prices broke out above that level back in early May. Although prices have slipped beneath this moving average a few times since then, each time the market remained close to the moving average and each time also represented a solid buying opportunity for those looking to accumulate the stock. |
 Figure 2: Does a retracement to the 50-day EMA suggest an opportunity to the long side might be in the making? Another factor is the gap up that developed in late October -- a gap that has yet to be filled more than 20 days later. This gap is also at the same approximate level of the 50-day EMA, which lends more credence to the notion of support at this level. Indicators -- both the stochastic (7, 10) and the MACD -- are bearish. The stochastic is moving swiftly toward oversold and the histogram in the MACD has continued to make lower and lower "spikes." In addition to the other factors mentioned above, one early hint that Boeing is ready to bounce will be when the daily MACD histogram makes its deepest spike. Specifically, I'm looking for the deepest spike to the downside to be followed by a shallower spike -- in other words, looking for the MACD histogram to make a confirmed low. Once the MACD histogram makes a low and begins to move up, the possibility that Boeing itself will begin to move up is great. |
| Yes, MACD histograms can create whipsaws. And "deepest" spikes in the MACD can be followed by even deeper spikes. But this shift -- when a "deepest" spike is followed by a shallower spike -- often strongly suggests that the momentum has shifted. And in the context of using other indicators such as the intermediate term, 50-day EMA, and the 7/10 stochastic, this particular use of the MACD histogram can be an effective way to help trigger entries during temporarily oversold markets in advancing trends. |
Technical Writer for Technical Analysis of STOCKS & COMMODITIES magazine, Working-Money.com, and Traders.com Advantage.
| Title: | Technical Writer |
| Company: | Technical Analysis, Inc. |
| Address: | 4757 California Avenue SW |
| Seattle, WA 98116 | |
| Phone # for sales: | 206 938 0570 |
| Fax: | 206 938 1307 |
| Website: | www.Traders.com |
| E-mail address: | DPenn@traders.com |
Traders' Resource Links | |
| Charting the Stock Market: The Wyckoff Method -- Books | |
| Working-Money.com -- Online Trading Services | |
| Traders.com Advantage -- Online Trading Services | |
| Technical Analysis of Stocks & Commodities -- Publications and Newsletters | |
| Working Money, at Working-Money.com -- Publications and Newsletters | |
| Traders.com Advantage -- Publications and Newsletters | |
| Professional Traders Starter Kit -- Software | |
Click here for more information about our publications!
Comments
Date: 12/16/03Rank: 4Comment:

Request Information From Our Sponsors
- StockCharts.com, Inc.
- Candle Patterns
- Candlestick Charting Explained
- Intermarket Technical Analysis
- John Murphy on Chart Analysis
- John Murphy's Chart Pattern Recognition
- John Murphy's Market Message
- MurphyExplainsMarketAnalysis-Intermarket Analysis
- MurphyExplainsMarketAnalysis-Visual Analysis
- StockCharts.com
- Technical Analysis of the Financial Markets
- The Visual Investor
- VectorVest, Inc.
- Executive Premier Workshop
- One-Day Options Course
- OptionsPro
- Retirement Income Workshop
- Sure-Fire Trading Systems (VectorVest, Inc.)
- Trading as a Business Workshop
- VectorVest 7 EOD
- VectorVest 7 RealTime/IntraDay
- VectorVest AutoTester
- VectorVest Educational Services
- VectorVest OnLine
- VectorVest Options Analyzer
- VectorVest ProGraphics v6.0
- VectorVest ProTrader 7
- VectorVest RealTime Derby Tool
- VectorVest Simulator
- VectorVest Variator
- VectorVest Watchdog
