HOT TOPICS LIST
- MACD
- Fibonacci
- RSI
- Gann
- ADXR
- Stochastics
- Volume
- Triangles
- Futures
- Cycles
- Volatility
- ZIGZAG
- MESA
- Retracement
- Aroon
INDICATORS LIST
LIST OF TOPICS
PRINT THIS ARTICLE
by Jason K. Hutson
Here are the Excel formulas for the Chaikin indicators using daily price data for Paramount.
Position: N/A
Jason K. Hutson
Traders.com Staff Writer. Enjoys trendlines, support and resistance, moving averages, RSI, MACD, ADX, Bollinger bands, parabolic SAR, chart formations, and volume analysis.
PRINT THIS ARTICLE
CHAIKIN OSCILLATOR
Chaikin Oscillator
07/31/00 05:34:52 PMby Jason K. Hutson
Here are the Excel formulas for the Chaikin indicators using daily price data for Paramount.
Position: N/A
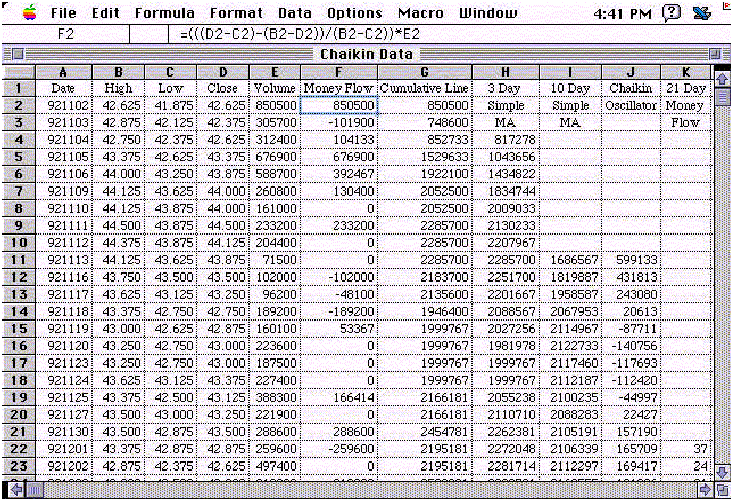
| In column F, the single day's measurement of money flow is calculated. The following formula is entered into cell F2 and copied down: =(((D2-C2)-(B2-D2))/(B2-C2))*E2 Column E is Volume Column D is Close Column C is Low Column B is High The cumulative line is calculated in column G. Start with the first day's value of the single day's money flow by entering the following formula into cell G1: =F2 |
| Then start the running total in cell G3 by entering the following formula in cell G3 and copying down: =F3+G2 |

|
| |
| The Chaikin oscillator is the difference between the three-period simple moving average and the 10-period simple moving average of the cumulative line. The three-period simple moving average is calculated in column H. The following formula is entered into cell H4 and is copied down: =AVERAGE(G2:G4) |
| The 10-period simple moving average of the cumulative line is calculated in column I. Enter the following formula into cell I11 and copy down: =AVERAGE(G2:G11) |
| The Chaikin oscillator is calculated in column J. The following formula is entered into cell J11 and is copied down: =H11-I11 This article taken in part from: Stocks & Commodities V. 12:1 (30-37): SIDEBAR: CHAIKIN INDICATORS |
Traders.com Staff Writer. Enjoys trendlines, support and resistance, moving averages, RSI, MACD, ADX, Bollinger bands, parabolic SAR, chart formations, and volume analysis.
| Title: | Industrial Engineer |
| Company: | Technical Analysis, Inc. |
| Address: | 4757 California Ave SW |
| Seattle, WA 98116 | |
| Phone # for sales: | 206 938 0570 |
| Website: | Traders.com |
| E-mail address: | JasonHutson@Traders.com |
Traders' Resource Links | |
| Charting the Stock Market: The Wyckoff Method -- Books | |
| Working-Money.com -- Online Trading Services | |
| Traders.com Advantage -- Online Trading Services | |
| Technical Analysis of Stocks & Commodities -- Publications and Newsletters | |
| Working Money, at Working-Money.com -- Publications and Newsletters | |
| Traders.com Advantage -- Publications and Newsletters | |
| Professional Traders Starter Kit -- Software | |
Click here for more information about our publications!
Comments
Date: / /Rank: 5Comment:

Request Information From Our Sponsors
- StockCharts.com, Inc.
- Candle Patterns
- Candlestick Charting Explained
- Intermarket Technical Analysis
- John Murphy on Chart Analysis
- John Murphy's Chart Pattern Recognition
- John Murphy's Market Message
- MurphyExplainsMarketAnalysis-Intermarket Analysis
- MurphyExplainsMarketAnalysis-Visual Analysis
- StockCharts.com
- Technical Analysis of the Financial Markets
- The Visual Investor
- VectorVest, Inc.
- Executive Premier Workshop
- One-Day Options Course
- OptionsPro
- Retirement Income Workshop
- Sure-Fire Trading Systems (VectorVest, Inc.)
- Trading as a Business Workshop
- VectorVest 7 EOD
- VectorVest 7 RealTime/IntraDay
- VectorVest AutoTester
- VectorVest Educational Services
- VectorVest OnLine
- VectorVest Options Analyzer
- VectorVest ProGraphics v6.0
- VectorVest ProTrader 7
- VectorVest RealTime Derby Tool
- VectorVest Simulator
- VectorVest Variator
- VectorVest Watchdog
