HOT TOPICS LIST
- MACD
- Fibonacci
- RSI
- Gann
- ADXR
- Stochastics
- Volume
- Triangles
- Futures
- Cycles
- Volatility
- ZIGZAG
- MESA
- Retracement
- Aroon
INDICATORS LIST
LIST OF TOPICS
PRINT THIS ARTICLE
by Kevin Hopson
EnCana Corp. (ECA) recently gapped above October's downtrend line, indicating the potential for higher prices in the near-term.
Position: Accumulate
Kevin Hopson
Kevin has been a technical analyst for roughly 10 years now. Previously, Kevin owned his own business and acted as a registered investment advisor, specializing in energy. He was also a freelance oil analyst for Orient Trading Co., a commodity futures trading firm in Japan. Kevin is currently a freelance writer.
PRINT THIS ARTICLE
GAPS
EnCana Corporation's Gap Line Breakout
12/02/03 10:02:15 AMby Kevin Hopson
EnCana Corp. (ECA) recently gapped above October's downtrend line, indicating the potential for higher prices in the near-term.
Position: Accumulate
| If you have followed my work over the past year, you know that I often integrate pitchforks into my chart analysis. One of the techniques I like to use, besides the basic pitchfork configuration, is trendline construction. Trendlines are one of the simplest and most effective ways to gauge support and resistance for prices. Trendlines are basically a connection of intraday highs or lows. The more pivot points (highs or lows) that occur along a particular trendline, the more significant support or resistance will be likely here. |
| An alternate version of the trendline is the gap line. This is a trendline that goes through the middle of a price gap. When prices move above this gap line, it is usually a sign of strength. Also, prices will often find support along this gap line when pulling back. This scenario is just the opposite with a gap down. In other words, when prices move below a gap line, it is usually a sign of weakness. Additionally, prices will often find resistance along this gap line when correcting. |

|
| Graphic provided by: Stockcharts.com. |
| |
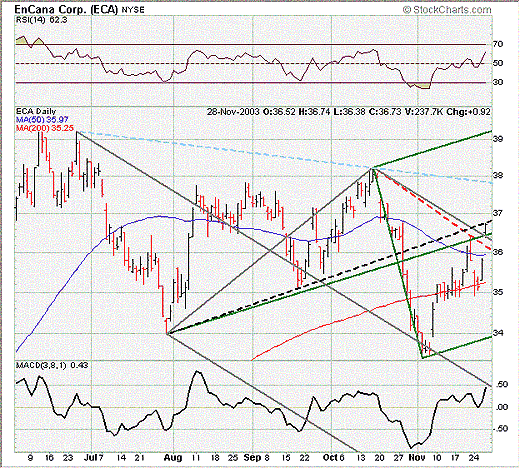
| Pitchforks, trendlines and gap lines are all illustrated in the six-month chart for EnCana Corp. For example, you will notice that EnCana recently overcame a confluence of resistance in the $36.00 to $36.50 range. More specifically, the stock moved above the green median line, the top gray parallel line and the red gap line (October's downtrend line). EnCana also overcame the 61.8 percent retracement level ($36.40) from the Oct.-Nov. decline, as well as its 50-day moving average ($35.97). As a result, prior resistance in the $36.00 to $36.50 range should now act as support. |
| In the meantime, EnCana faces near-term resistance around the $36.80 level, the site of July's former uptrend line (dotted black line). If the stock can overcome resistance here, the next upside target would likely be June's downtrend line (dotted blue line), which is converging around the $37.80 level. Given EnCana's recent gap up and the confluence of support at slightly lower levels, I would look to accumulate the stock on near-term price weakness. |
Kevin has been a technical analyst for roughly 10 years now. Previously, Kevin owned his own business and acted as a registered investment advisor, specializing in energy. He was also a freelance oil analyst for Orient Trading Co., a commodity futures trading firm in Japan. Kevin is currently a freelance writer.
| Glen Allen, VA | |
| E-mail address: | hopson_1@yahoo.com |
Click here for more information about our publications!
PRINT THIS ARTICLE

|

Request Information From Our Sponsors
- StockCharts.com, Inc.
- Candle Patterns
- Candlestick Charting Explained
- Intermarket Technical Analysis
- John Murphy on Chart Analysis
- John Murphy's Chart Pattern Recognition
- John Murphy's Market Message
- MurphyExplainsMarketAnalysis-Intermarket Analysis
- MurphyExplainsMarketAnalysis-Visual Analysis
- StockCharts.com
- Technical Analysis of the Financial Markets
- The Visual Investor
- VectorVest, Inc.
- Executive Premier Workshop
- One-Day Options Course
- OptionsPro
- Retirement Income Workshop
- Sure-Fire Trading Systems (VectorVest, Inc.)
- Trading as a Business Workshop
- VectorVest 7 EOD
- VectorVest 7 RealTime/IntraDay
- VectorVest AutoTester
- VectorVest Educational Services
- VectorVest OnLine
- VectorVest Options Analyzer
- VectorVest ProGraphics v6.0
- VectorVest ProTrader 7
- VectorVest RealTime Derby Tool
- VectorVest Simulator
- VectorVest Variator
- VectorVest Watchdog
