HOT TOPICS LIST
- MACD
- Fibonacci
- RSI
- Gann
- ADXR
- Stochastics
- Volume
- Triangles
- Futures
- Cycles
- Volatility
- ZIGZAG
- MESA
- Retracement
- Aroon
INDICATORS LIST
LIST OF TOPICS
PRINT THIS ARTICLE
by Koos van der Merwe
Funeral homes and crematoriums are a must for everybody at some time. By all accounts good profits could be made by well managed companies, yet they haven't, so what went wrong, and how does the future look?
Position: N/A
Koos van der Merwe
Has been a technical analyst since 1969, and has worked as a futures and options trader with First Financial Futures in Johannesburg, South Africa.
PRINT THIS ARTICLE
CUP WITH HANDLE
Price Targets For Stewart Enterprises, Inc.
12/01/03 12:13:41 PMby Koos van der Merwe
Funeral homes and crematoriums are a must for everybody at some time. By all accounts good profits could be made by well managed companies, yet they haven't, so what went wrong, and how does the future look?
Position: N/A
| Stewart Enterprises, Inc. is a provider of products and services in the death care industry in North America. The company is a leader in the industry's movement toward the integration of funeral home and cemetery operations; the establishment of combined facilities; and complete death care planning and delivery. Through its subsidiaries, the company operates 196 funeral homes and 114 cemeteries in 21 states, Puerto Rico, Mexico, Australia, and New Zealand. The company is the third largest publicly traded company in its industry in North America, serving thousands of people through its funeral homes, cemeteries and crematoriums. |
| Funeral homes were hit rather badly when the Loewen Group nearly went into bankruptcy. (Or perhaps did. They have started recovering under the name Alderwoods.) It is not surprising therefore that Stewart Enterprises fell along with them. |

|
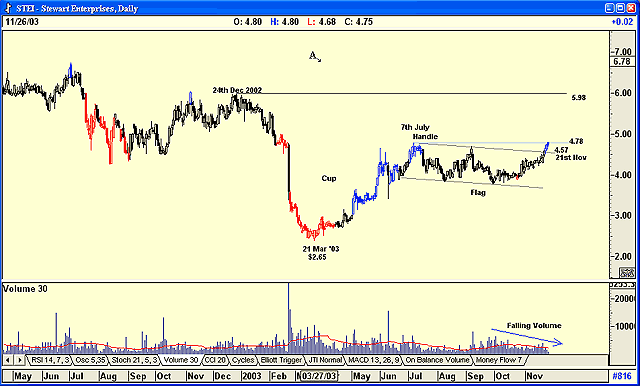
| Is Stewart Enterprise off the death watch? |
| Graphic provided by: AdvancedGET. |
| |
| Any bad publicity did not help the share price in any way. From the high of $8.10 on June 8, 2001 (not shown on chart), the price has fallen quite dramatically, reaching a low of $2.65 in March 2003. It was a good run for the bears, and a great deal of profit could have been made. The period from December 24, 2002 until March 21, 2003 was particularly bad, as the share price dropped from $5.98 to $2.65 in three months, a drop of 55.6% on strong volume. Since the low of $2.65 in March, the share price has started recovering and has formed a cup with handle at $4.78. |
| In April the company announced it was purchasing a program to assist in the implementation and execution of strategy. The program purchased from Comshare encompasses planning, budgeting, forecasting, financial consolidation, management reporting, and analysis. Whether this was the reason for recovery in the share price or not is immaterial. The simple fact that the company was modernizing its operations was a plus, and the share price moved up strongly. By July 7th it was up to $4.78. Since that date, it appears to be drifting down in a flag pattern. However, on November 21st, it broke out of that pattern and started testing the resistance level of the handle of the cup with handle pattern at $4.78. But this has been on falling volume, a sign of weakness. Now there are two feasible targets should the price break above $4.78 on strong volume. The targets are: 1. Cup and handle: $6.91 (4.78-2.65 = 2.13+4.78 = 6.91). 2. Flag: $6.49 (4.57 - 2.65 = 1.92 + 4.57 = 6.49). |
| Either target is feasible, but -- and it is a big BUT -- the price must move up on stronger volume. Any upward move on falling volume is a sign of weakness. This is a share you could place on your watch list. |
Has been a technical analyst since 1969, and has worked as a futures and options trader with First Financial Futures in Johannesburg, South Africa.
| Address: | 3256 West 24th Ave |
| Vancouver, BC | |
| Phone # for sales: | 6042634214 |
| E-mail address: | petroosp@gmail.com |
Click here for more information about our publications!
PRINT THIS ARTICLE

Request Information From Our Sponsors
- StockCharts.com, Inc.
- Candle Patterns
- Candlestick Charting Explained
- Intermarket Technical Analysis
- John Murphy on Chart Analysis
- John Murphy's Chart Pattern Recognition
- John Murphy's Market Message
- MurphyExplainsMarketAnalysis-Intermarket Analysis
- MurphyExplainsMarketAnalysis-Visual Analysis
- StockCharts.com
- Technical Analysis of the Financial Markets
- The Visual Investor
- VectorVest, Inc.
- Executive Premier Workshop
- One-Day Options Course
- OptionsPro
- Retirement Income Workshop
- Sure-Fire Trading Systems (VectorVest, Inc.)
- Trading as a Business Workshop
- VectorVest 7 EOD
- VectorVest 7 RealTime/IntraDay
- VectorVest AutoTester
- VectorVest Educational Services
- VectorVest OnLine
- VectorVest Options Analyzer
- VectorVest ProGraphics v6.0
- VectorVest ProTrader 7
- VectorVest RealTime Derby Tool
- VectorVest Simulator
- VectorVest Variator
- VectorVest Watchdog
