HOT TOPICS LIST
- MACD
- Fibonacci
- RSI
- Gann
- ADXR
- Stochastics
- Volume
- Triangles
- Futures
- Cycles
- Volatility
- ZIGZAG
- MESA
- Retracement
- Aroon
INDICATORS LIST
LIST OF TOPICS
PRINT THIS ARTICLE
by Gary Grosschadl
This past week has seen gold finally rise to briefly touch the $400 barrier for the futures (Comex) traders while the spot price reached a high of $398.
Position: Hold
Gary Grosschadl
Independent Canadian equities trader and technical analyst based in Peterborough
Ontario, Canada.
PRINT THIS ARTICLE
ANDREWS PITCH-FORK
Gold Support And Resistance
12/01/03 12:03:03 PMby Gary Grosschadl
This past week has seen gold finally rise to briefly touch the $400 barrier for the futures (Comex) traders while the spot price reached a high of $398.
Position: Hold
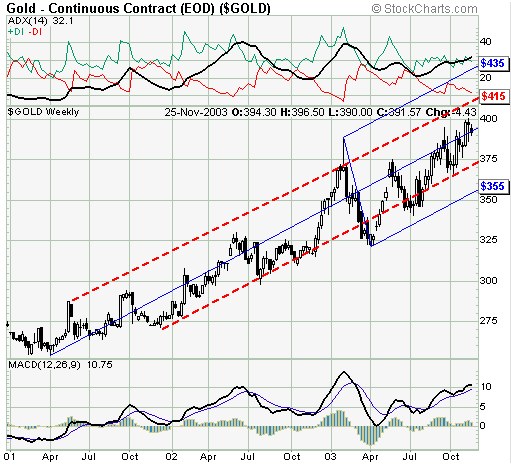
| To determine where gold prices could be headed, a pichfork chart was drawn to show possible areas of support and resistance. Choosing these three major pivot points for the gold continuous contract has the pitchfork taking an obvious bullish stab upwards. Note how most of the price action has been contained between the median line and the lower median line. |
| A mainstay of pitchfork theory is that price tends to move to the median line. Since April, four such moves have been made with a slight overshoot. As long as this price action is contained within these lines, the trend remains bullish. With the gold price at the median line, consideration should be given to upside and downside possibilities. |

|
| Weekly gold chart with upside and downside targets. |
| Graphic provided by: Stockcharts.com. |
| |
| A super bullish move would mean a push up to the top fork or upper median line with a bold target of $435. On the other hand a bearish move to test lower support could mean a downleg to test the lower fork at $355. These represent rather large swings in price and one or more will eventually occur, but in the meantime smaller targets should also be considered. Pitchfork traders will often use additional lines and one such technique is called sliding parallels. One obvious place to put a sliding parallel is centered between the existing forks. I've follow these lines back in time and they correspond fairly well to two or more stategic points. So it is reasonable to assume they may also show some relevence going forward as well. This gives the intermediate targets of $415 to the upside and $375 to the downside. Failure of these levels to hold then brings the bigger median line targets into play, those being $435 and $355. |
| Two indicators also reflect the bullish path on this weekly chart. The rising ADX line (top graph) refects growing trend strength. Ideally this line stays below the +DI component or this ADX line eventually "overheats" and comes to a peak and eventually reverses, as on previous occasions -- something to watch for in the coming weeks. The MACD or moving average convergence/divergence is also rising bullishly. Note how well in the past a bearish crossing of the lines (MACD line through its smaller signal line) indicated a coming downleg. Traders would be advised to treat a similar occasion with due respect. |
| So in summary this bullish pitchfork shows possible upside and downside targets. As long as the price movement is contained within the forks the trend remains up, however the price swings can be wide ranging. The next significant downleg may be foretold using the two indicators as discussed with possible downside targets as shown. |
Independent Canadian equities trader and technical analyst based in Peterborough
Ontario, Canada.
| Website: | www.whatsonsale.ca/financial.html |
| E-mail address: | gwg7@sympatico.ca |
Click here for more information about our publications!
Comments
Date: 12/01/03Rank: 5Comment:
Date: 12/07/03Rank: 5Comment:
Date: 12/16/03Rank: 4Comment:
Date: 12/19/03Rank: 5Comment: please send us reason current bullishness about gold?

Request Information From Our Sponsors
- StockCharts.com, Inc.
- Candle Patterns
- Candlestick Charting Explained
- Intermarket Technical Analysis
- John Murphy on Chart Analysis
- John Murphy's Chart Pattern Recognition
- John Murphy's Market Message
- MurphyExplainsMarketAnalysis-Intermarket Analysis
- MurphyExplainsMarketAnalysis-Visual Analysis
- StockCharts.com
- Technical Analysis of the Financial Markets
- The Visual Investor
- VectorVest, Inc.
- Executive Premier Workshop
- One-Day Options Course
- OptionsPro
- Retirement Income Workshop
- Sure-Fire Trading Systems (VectorVest, Inc.)
- Trading as a Business Workshop
- VectorVest 7 EOD
- VectorVest 7 RealTime/IntraDay
- VectorVest AutoTester
- VectorVest Educational Services
- VectorVest OnLine
- VectorVest Options Analyzer
- VectorVest ProGraphics v6.0
- VectorVest ProTrader 7
- VectorVest RealTime Derby Tool
- VectorVest Simulator
- VectorVest Variator
- VectorVest Watchdog
